
An online shop's sales stand and fall with its performance. Many online retailers know the problem that loading times are very high for no immediately obvious reason. Such a "bottleneck" can, for example, be based on small problems in the code and thus significantly slow down the other processes. With the profiling tool "Blackfire IO", such causes can be quickly identified.
We were convinced by this profiler for the quick analysis of error sources. That is why we have integrated a function for the quick installation of Blackfire in our Managed Centre.
What can Blackfire IO be used for?
Blackfire is an analysis tool that can be used to profile PHP applications for the purpose of collecting data about time, CPU, I/O wait, memory, network calls, HTTP and SQL requests. This data is clearly visualised in various graphs. Bottlenecks can thus be recognised at a glance.
Blackfire IO editions
Blackfire is primarily suitable for analysing HTTP requests. This can already be done with the free "Hack Edition". With this version, most reproducible performance bottlenecks can also be resolved. Other features of the Hack Edition: analysis of command line scripts and API calls, profiling by execution time and memory usage, PHP SDK for custom metrics. Please note that this version cannot be used with maxcluster.
From the Profiler Edition onwards, values can also be queried, such as: CPU consumption, I/O, SQL queries. Reference profiles can also be created.
The Premium Edition contains all the features of the Profiler Edition plus: performance assertions, planned builds, more reference profiles. With the Premium or Enterprise Edition, you can also write your own tests and scenarios.
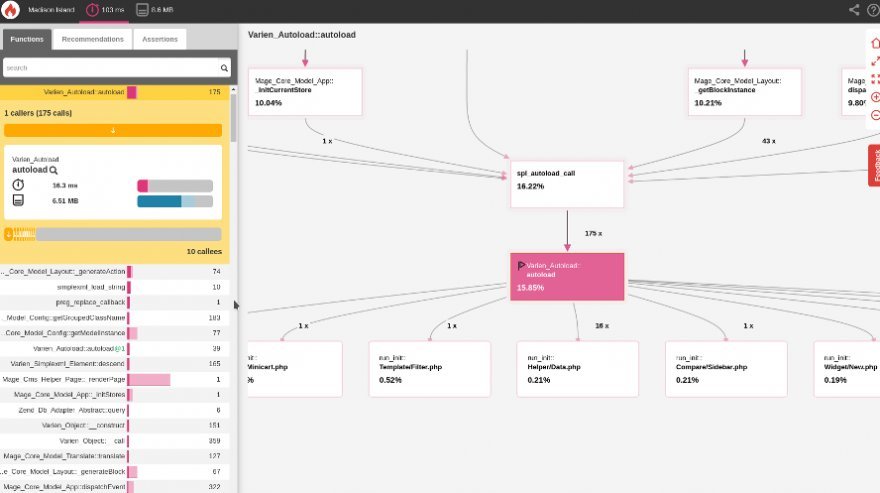
Analysis view with Blackfire (Hack Edition)
On the left side, the inclusive duration and the exclusive duration of functions are shown. The inclusive duration refers to the duration that the function requires including the sub-function. The exclusive duration refers only to the period of time that the function requires without the sub-function.
Each function can be selected and viewed individually in detail. The screenshot shows an example of the "autoload" function in the yellow box. Here, the number of calls, sub-functions as well as time and memory consumption are displayed. Individual sub-calls can also be analysed in detail (see screenshot 2). On the right-hand side, the call graph shows the flow of the application.
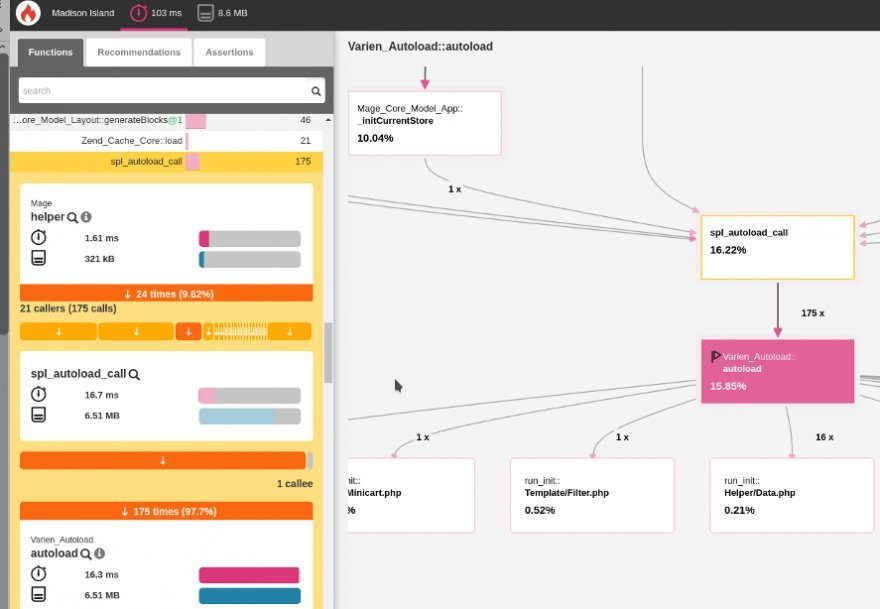
Detailed view of the functions (Hack Edition)
1. Analysis of HTTP requests
The main field of application of Blackfire is the analysis of HTTP requests by website visitors, API or web service calls. Blackfire does not monitor web applications in real time. Blackfire therefore does not constantly collect data from real users. As long as no HTTP request is to be analysed, Blackfire is not active. Monitoring is only activated in case of performance problems and only by authorised users. (This activation process is described later in the application example.) In this way, the profiler can also be used on productive servers and in projects with high traffic without performance losses. A special feature of Blackfire is that even in the free Hack Edition, the memory and time consumption of web applications can be analysed (see screenshot 3: Memory Profling).
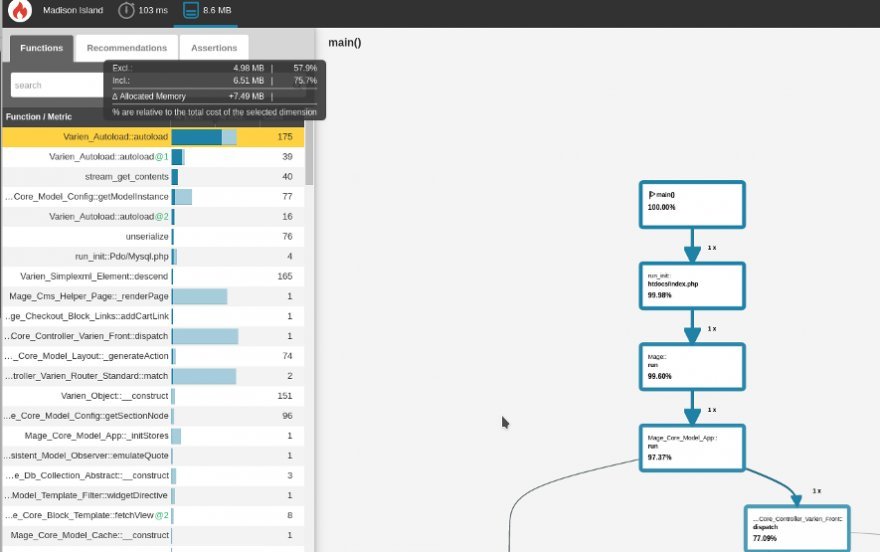
Memory Profiling (Hack Edition)
On the left side, the inclusive memory allocation and the exclusive memory allocation of the individual functions are listed. On the right side, the call graph is shown by default.
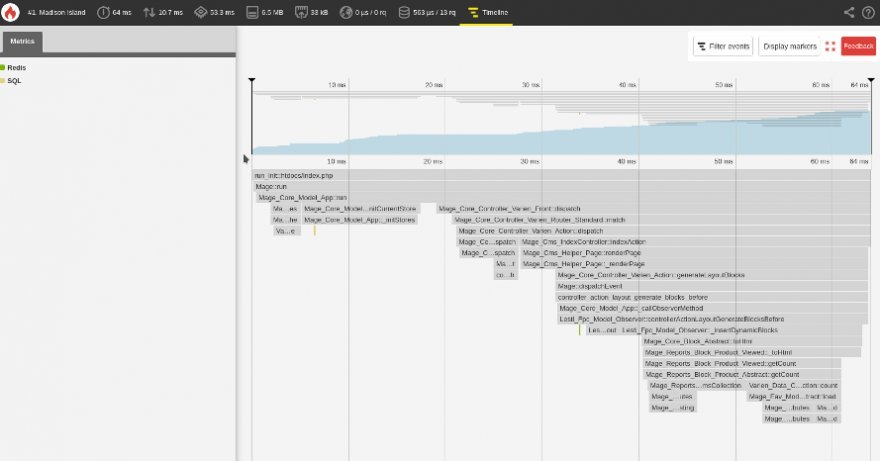
Timeline (Profiler Edition)
A detailed timeline can be displayed from the Profiler Edition (see screenshot 4: Timeline). All other metrics already described can also be displayed here.
Another interesting feature is the analysis of SQL queries. This feature is available from the Profiler Edition. (See screenshot 5: SQL analysis).
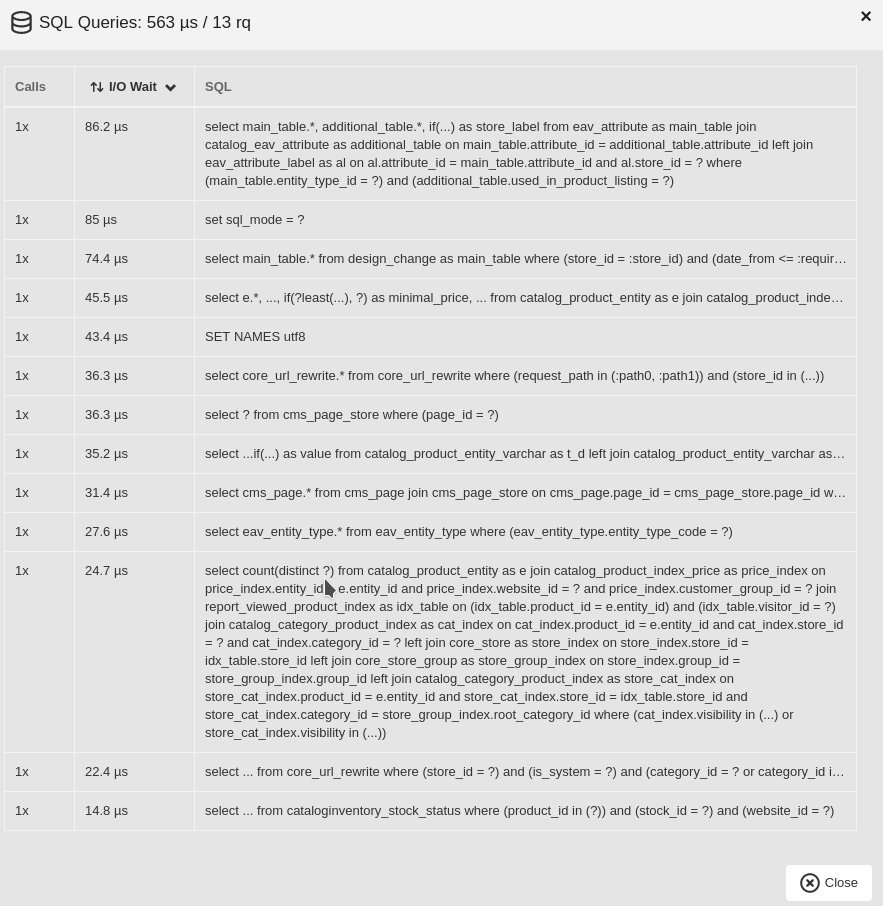
SQL Analysis (Profiler Edition)
Application example for HTTP analysis with Chrome Plugin
After updating several modules for a Magento online shop, the overview pages of the products are much slower as a result. It is not possible to determine which module is responsible for the slowdown.
Blackfire helps in this case to create targeted profiling for an overview page. After installing "Blackfire Companion" for Chrome, the developer can visit an overview page in the shop and simply click the "Profile" button of Chrome Companion to start the analysis.
A short time later, profiling appears in his Blackfire account. This enables the developer to quickly and easily recognise which module or which part of the module's code is responsible for the increased loading time.
2. Analysis of CLI commands
Blackfire can also be used to analyse code in the command line. Simple PHP CLI scripts or specific parts of a code can be analysed.
Ex. cron.php: The following command calls up and analyses cron.php.
blackfire run cron.php
Furthermore, various examples are listed in the „Docs“ on the Blackfire homepage.
3. Create reference profiles
From the Profiler Edition of Blackfire, for which a fee is charged, reference profiles can be created. This allows planned changes to the code to be tested in advance and displayed in a second profile. The simultaneous view of two profiles offers an ideal before-and-after comparison that can be used to evaluate the effects of the desired changes. Direct comparison between two code states (e.g. staging and live) is also possible.
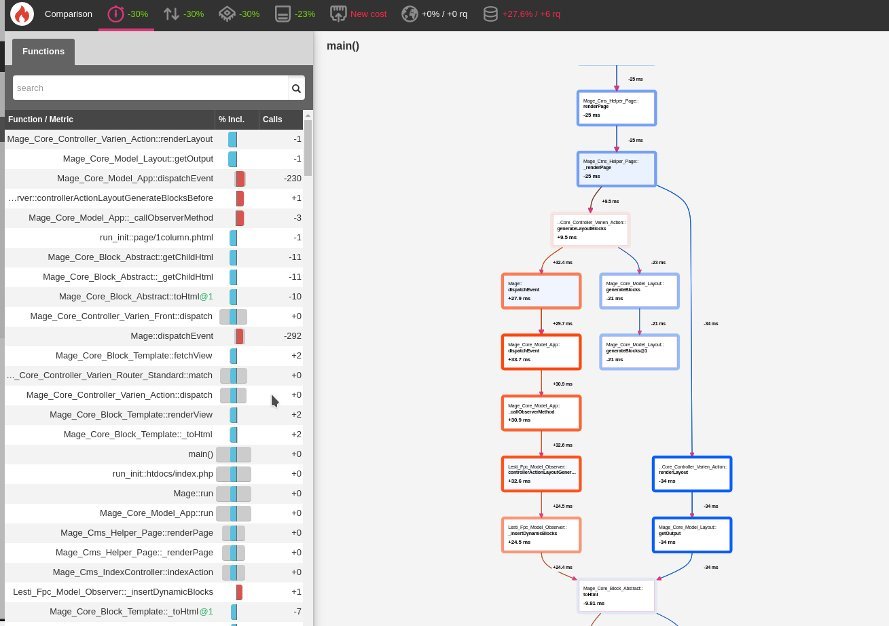
Screenshot 6: Comparison with a reference profile
In the comparison display, a page view can be compared with a reference profile. Basically, you can see in detail which functions were accelerated or slowed down. In addition, the comparison shows how the number of calls changes and how this subsequently affects the overall result of the web page call. This example shows the effects of "Lesti Fpc" on a Magento shop (sample data).
4. Write your own tests
With Blackfire in the Premium or Enterprise Edition, it is possible to write your own performance tests. This allows developers to test their code thoroughly. Own metrics can also be added as desired. In addition, the environment can be adapted to your own work processes. This allows teams to work together on all environments: Development, Testing, Staging and Production.
With Blackfire, tests can also be automated and scheduled at any time. Furthermore, you can set whether you only want to be notified when error sources are found or always when the test report is completed.
5. Write your own scenario
In the Premium or Enterprise Edition, developers can even write their own scenarios. A Blackfire scenario is, in short, a list of important URLs that are regularly profiled. This is particularly useful when a new version of the application is automatically tested for performance.
Set up Blackfire IO at maxcluster
In our Managed Center, you can find the new button "Blackfire IO" under "Profiler". After clicking on it, a pop-up opens in which you only have to enter the server ID and the Blackfire token. You will receive the token directly from Blackfire Pricing after creating an account.
For an easier analysis, we also recommend the Blackfire Companion for Chrome.
