
What is New Relic APM?
New Relic APM (Application Performance Monitoring) is a monitoring tool that can be used to continuously monitor the performance of an online shop in real time. When a problem occurs, such as long loading times, New Relic locates a bottleneck and automatically sends a message to a defined person.
New Relic APM is also suitable for detailed analysis of the performance metrics of web applications. Due to the well-structured dashboard, the analyses can be displayed and evaluated very clearly. The special feature of this software is that a large number of metrics can be compared with each other. No other tool for the e-commerce sector has this high degree of comparison possibilities. However, this makes the tool very complex and it takes a lot of time to get to know all the functions.
New Relic Editions
New Relic APM is one of the most comprehensive tools for profiling in e-commerce and is available in two editions: APM Essentials and APM Pro.
All important functions can already be operated with the standard edition APM Essentials: Application monitoring, availability and error monitoring, alarm notifications and user administration. In the Pro Edition, further useful features are added. For example, the so-called key business transactions can be monitored separately or subaccounts can be limited to specific applications.
From APM Pro onwards, informative comparisons can be made for planned changes to the code by means of a before-and-after view. Alerts are even more detailed than in the Standard Edition. There are also SLA reports on a daily, weekly or monthly basis, which provide excellent clarification of periodic performance anomalies.
The New Relic family also includes other programms such as New Relic Infrastructure, which can be used to monitor the hardware resources of several servers. Furthermore, New Relic Browser can be used to monitor the performance of the browser-side part of the application (such as the execution of JavaScript). With New Relic Synthetics, visitor behaviour can be artificially simulated so that problems can be detected in time before they possibly occur in a live environment. New Relic Insight makes it possible to bundle all data from the various New Relic services to provide a complete overview of all business processes. Last but not least, New Relic Mobile monitors the performance of Android and iOS applications.
Monitoring with New Relic APM
Monitoring and profiling with New Relic APM is done via a well-structured dashboard (see: Screenshot 1: Dashboard overview).
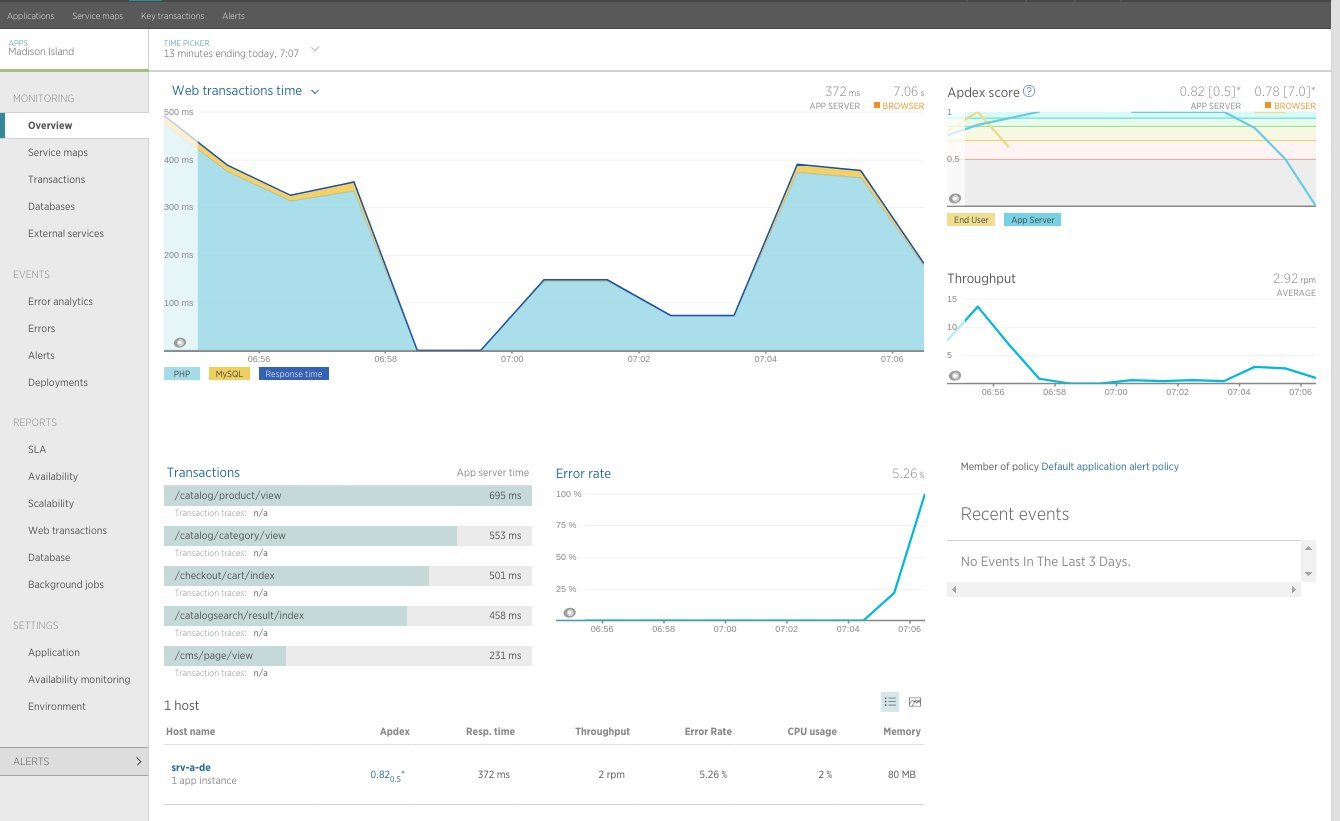
Screenshot 1: Dashboard overview
On the left is the side menu with the main categories Monitoring, Events, Reports, Settings and Alerts. These include further sub-categories with useful monitoring views, some of which are only available from APM Pro. In the following, we present the most efficient features of APM for e-commerce in our experience.
Overview
The first sub-category is a general overview under "Overview". The overview shows previous transactions and error rates as well as the load time score (Apdex score). For the evaluation of the transactions, the time diagram "Web transactions time" (in the screenshot in the middle above) is available, which shows the execution times for PHP and MySQL in milliseconds. In this time diagram, it would also be noticeable if a page has particularly slow loading times (see screenshot 2: Web transactions time). The next screenshot 2 demonstrates the temporal progression with strong short-term slowdowns. This data is available for 3 days in the Essentials Edition and for 90 days in the Pro Edition. With regard to the long-term analysis, maxcluster recommends the Pro Edition for this reason.
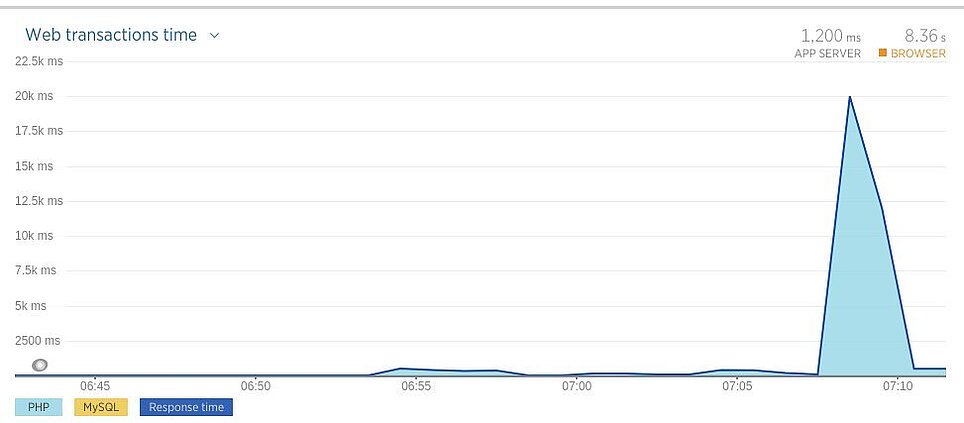
Screenshot 2: Web transactions time
Transactions
The bar chart "Transactions" (screenshot 1) is used to evaluate transactions. This shows the individual web page calls with the respective execution time. To the right, a diagram shows the percentage error rates, including the respective time at which the error occurred.
On the right side of the screenshot, you can see the Apdex score. This score represents the average value of the loading time. The "Throughput" diagram below shows the number of requests at a certain point in time. Finally, at the bottom of the overview, the servers on which the application is installed are displayed under "Host".
The loading times can also be displayed as a histogram (see: Screenshot 3: Web transactions histogram). This allows you to see the exact distribution of the loading times of web calls as a percentage.
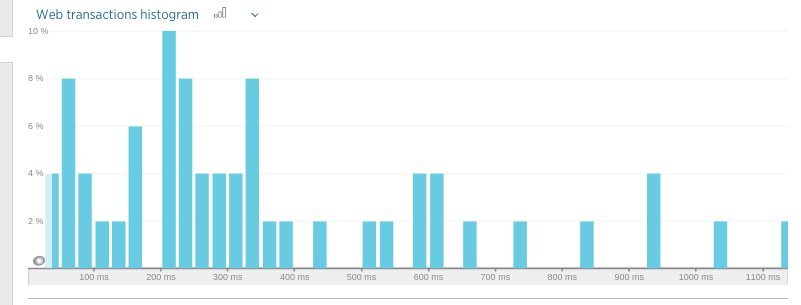
Screenshot 3: Web transactions histogram
Transactions and profiling
Profiling can be carried out in New Relic APM via the view in the subcategory "Transactions" (see screenshot 4: Transaction trace: Summary). The transactions can be viewed under the headings Summary, Trace Details and Database Queries. In the Summary you can see the function calls with the highest loading time. The different functions are separated from each other by colour.
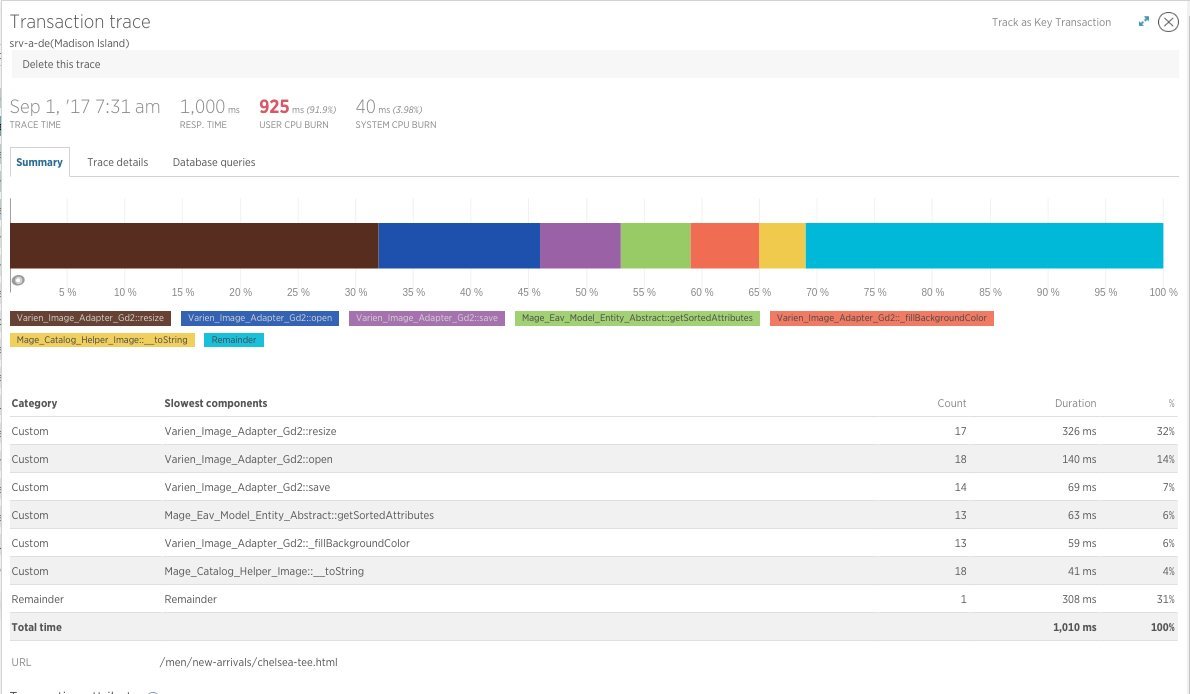
Screenshot 4: Transactions trace: Summary
In the next section "Trace details" (see screenshot 5: Trace details), the technically responsible person receives further time information on the function calls. Here the function calls are broken down into a tree structure. Function calls are displayed with the associated sub-functions and their times. In the Essentials Edition, this data is stored for 3 days and in the Pro Edition for 7 days.
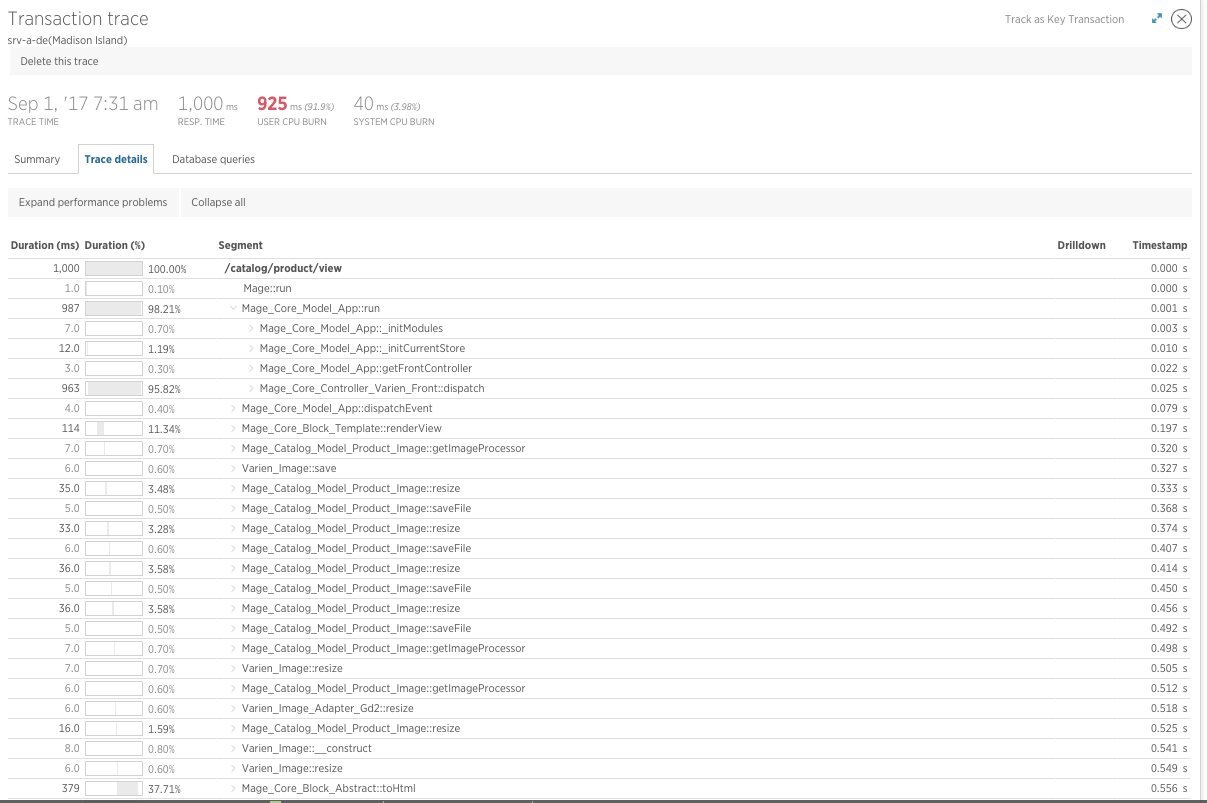
Screenshot 5: Trace details
In the third section, "Database queries", you can view the signatures of individual database queries and their runtime (see screenshot 6: Database queries). This section shows how often each database query was executed and the total execution time required for this database query. This makes it easy to see which database queries had the greatest impact on the loading time of the shop page.
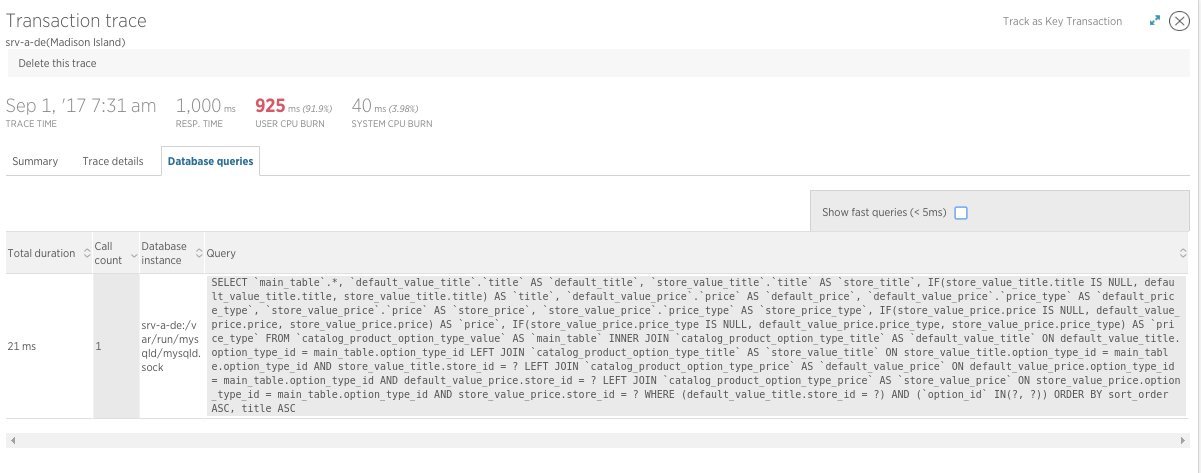
Screenshot 6: Database queries
Databases
The next sub-category "Databases" shows a bar chart on the left side (see screenshot 7: Databases). This illustrates the different types of database queries with time information. In our example, it is sorted by the largest time consumption per query type. On the right side, the "MySQL Overview" is shown in two diagrams. The upper diagram illustrates the time consumption of the queries at a certain time. The lower diagram "Top database operations by query time" shows a breakdown by query type. It shows when data was inserted, deleted, changed or read.
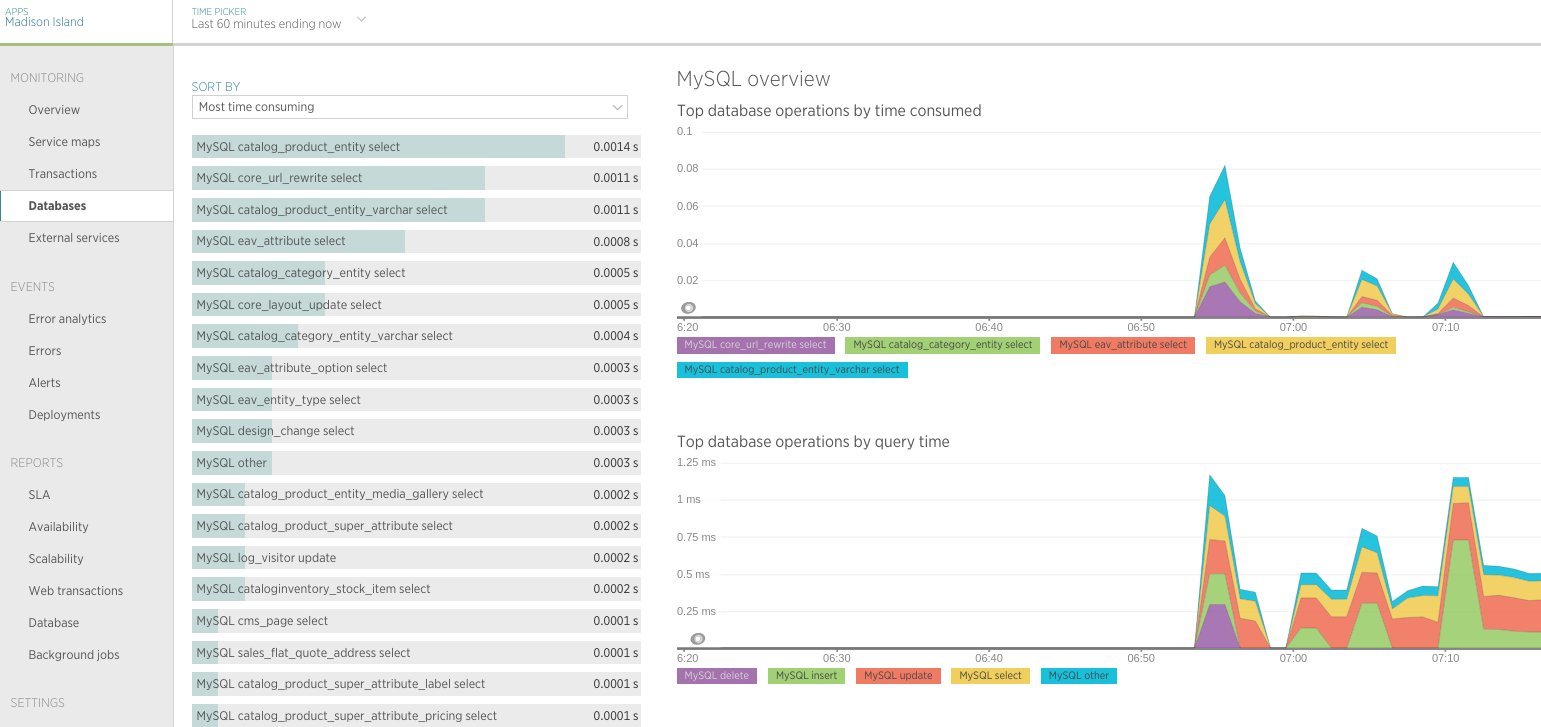
Screenshot 7: Databases
Error analysis
Under the main category "Events" you will find the area "Error analytics" (see screenshot 8: Error analytics). On the right side you can see the error rate in percent and below that the most frequent error classes. At the bottom right of the screenshot, the specific errors are listed. These are listed in detail as error messages with traces and with their first and last occurrence.
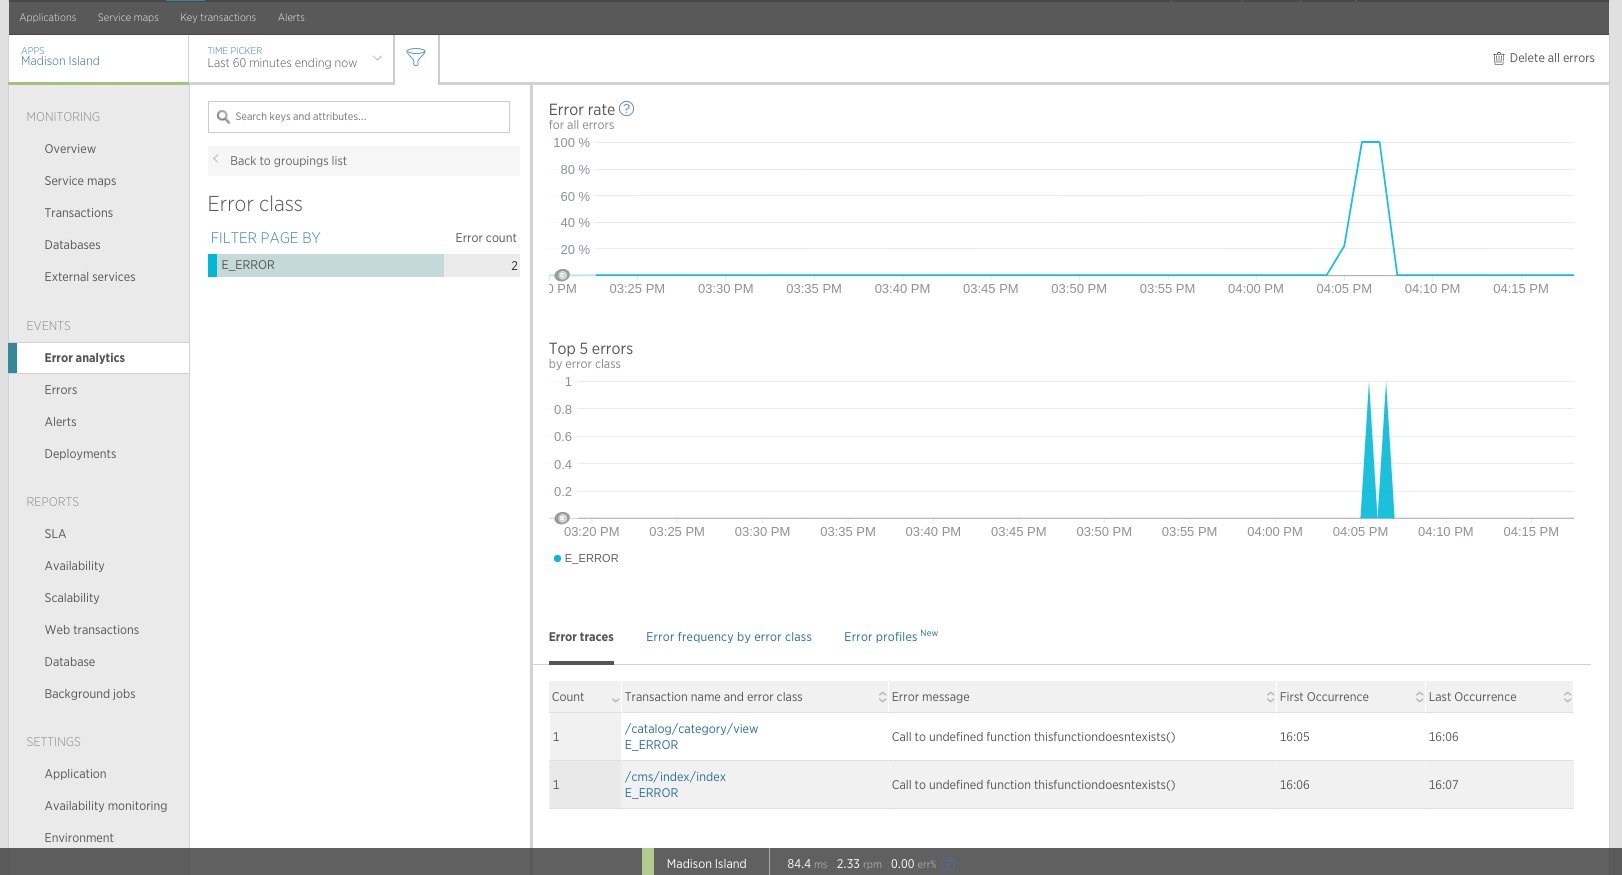
Screenshot 8: Error analytics
Alerting and notification
A very important feature of New Relic APM is the alerting (alerts) under the main category "Events" (see screenshot 9: Alerts). As soon as the error rate rises above a set threshold or the score falls below a set value, New Relic automatically sends messages by email or via another set communication channel. The screenshot shows the alarms that are currently set. Here, only one alarm has been set, which appears when the Apdex falls below 0.7 or the error rate rises above 5 percent. In addition, past alarms can be viewed retrospectively.
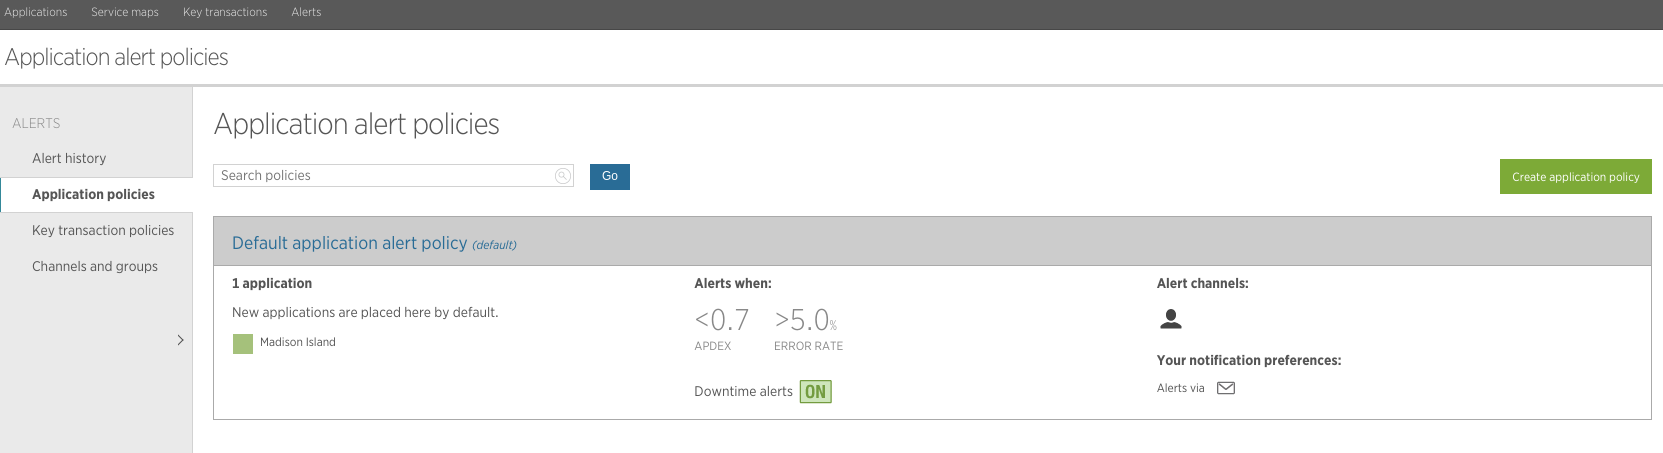
Screenshot 9: Alerts
Application example
To illustrate, we would like to describe a typical problem case and how it can be solved by using New Relic APM.
In this example, an online shop is frequently expanded or changed with new functions. For the person technically responsible for the shop, it is very important that the performance does not suffer from the changes. For this reason, he uses New Relic APM for his online shop. After testing new functions in a test environment, he installs them in the live environment. Via the New Relic API, he can even mark the new features as a release in the New Relic Timeline.
The tool presented here continuously evaluates the performance of the online shop in the background. The person technically responsible for the shop sets a certain threshold value for the Adpex score, which should not be undercut. If the value falls below this limit, the person responsible immediately receives an email.
In our case study, long page loading times occur after a module update, even though the update had no effect on performance in a test environment. The technical manager receives a warning by email and then looks at the traces in the dashboard. Since he can see there which traces took a particularly long time, he can find the bottleneck. Using the traces, he can finally find the code in a plug-in that is responsible for the low performance. Based on this, he will finally determine the problem more precisely by means of analyses and work out a solution.
Set up New Relic APM at maxcluster
New Relic APM can be set up at maxcluster with just a few clicks. In our Managed Center, you will find the menu item "Profiler" with the button "Set up New Relic". There you enter your licence key and title your application. Then activate New Relic APM with a single click. The configuration can now be (de)activated at any time and finally applies to the entire cluster.
More posts in this blog series
- Identifying bottlenecks with 3 efficient profiling tools
- Part 1: Blackfire IO
- Part 2: Tideways
- Part 4: Comparison of the profilers Blackfire, Tideways and New Relic
