What is Tideways used for?
Tideways analyses server-side PHP processes. The programme can analyse individual pages as well as the entire online shop. The strength of Tideways lies in the runtime analysis of a PHP call. But Tideways can also analyse bottlenecks in other scenarios. If, for example, it is determined that the shop is using an unusually high amount of RAM, this profiler can be used to locate the website call responsible. In this case, Tideways shows which calls have consumed how much RAM.
Tideways Editions
The Profiler Tideways can be purchased in three editions after a free 14-day trial period: Basic, Standard and Pro. All three editions contain the same profiling features as well as monitoring. The differences in the price categories are calculated, among other things, from the number of traces per month, the duration of the "retention" and the limitation of the number of servers. The standard version also has a histogram and the pro version also has SQL and downstream layers and alerts.
Even with the Basic Edition, efficient profiling can be created, which is sufficient for the targeted search for bottle necks. From the Standard Edition onwards, further convenient services are added. Particularly noteworthy is the profiler's notification function, whereby the person technically responsible receives information by e-mail about events such as application failures or high loading times. Starting with the Basic Edition, multi-service projects (e.g. CMS and shop such as Magento and WordPress or microservices) as well as multi-environments (e.g. production & staging server) can be implemented. In addition, a REST API is available from this edition onwards. From the standard edition, teams can be managed and synchronised with Github.
In addition to the regular versions, there are now also 2 Developer Editions. These have only limited monitoring, but allow the monitoring of 10 applications (Profiler 10 Edition) or an unlimited number of applications (Profiler Unlimited Edition). These two editions are therefore of particular interest to developers and agencies that manage several online shops.
Profiling
Profiling can be evaluated in four different views: timeline, summary, call table and call graph.
Timeline
A special feature of Tideways is already the first view, the timeline. Here, data is displayed according to its duration (see screenshot 1: Tideways Timeline). This makes it possible to clearly view the runtimes and calls of individual functions. In the timeline tracing, the individual functions are displayed according to their time consumption in milliseconds. The functions are displayed in colour according to their corresponding category, such as App, PHP, SQL, Events, Controller, Views. The functions can also be viewed in more detail. If a function is selected in the timeline, detailed information appears in the box on the right.
In our screenshot, for example, the time needed to start the function and the duration of use, the framework and the user are displayed. The detailed information that can be called up depends on the respective category.
Tideways recognises the PHP application in use during profiling and can thus, among other things, already display a highlighting of controller and view functionalities. The so-called "N+1 Detection" indicates when functions are called repeatedly in a similar way. This offers the possibility of identifying code passages with particularly high optimisation potential.
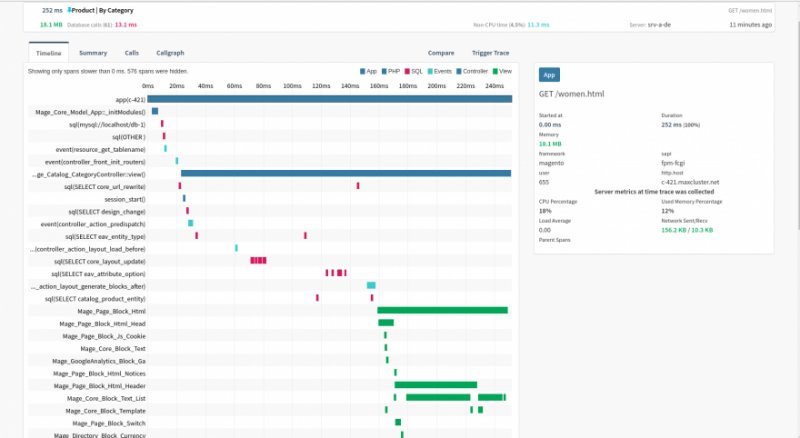
Screenshot 1: Tideways timeline
The "SQL" section displays anonymised versions of SQL queries with their respective durations (see screenshot 2: SQL section). In addition, it shows their execution time.
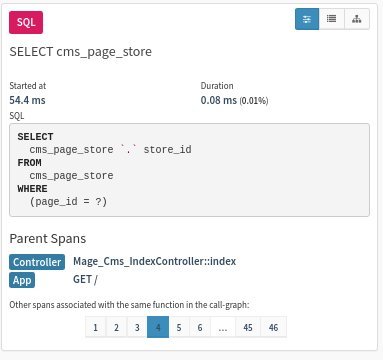
Screenshot 2: Category SQL
Summary
The second view for evaluation is the summary under the tab of the same name "Summary" (see screenshot 3: Summary). Here, the functions are listed by category and displayed with their duration of use. For a detailed view, the categories can be clicked on.
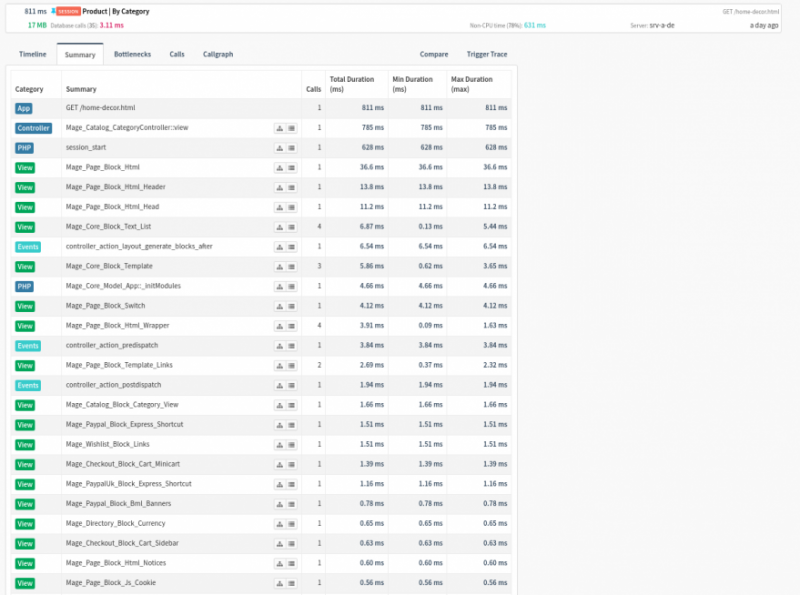
Screenshot 3: Summary
When Tideways identifies problem areas, they are displayed in another tab called "Bottleneck". Here, information appears in text form that contains possible causes and suggested solutions.
Call table
The third evaluation view is the call table (see screenshot 4: Call table). In this table it is easy to see how long the inclusive duration and the exclusive duration of the individual functions took and how often they were called.
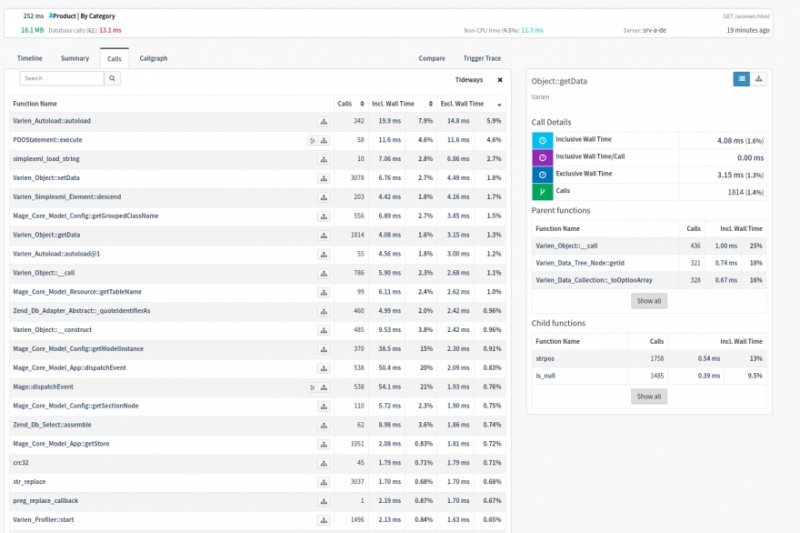
Screenshot 4: Call table
Call graphs
The function calls of each PHP request can also be displayed in detail in the fourth view, the call graph. This also allows a before-and-after comparison for planned optimisations to the code (see screenshot 5: call graph and screenshot 6: comparison view). A call table is again displayed on the right-hand side and the call graph on the left-hand side. With this graphical representation, it is possible to see at first glance which function was called by which higher-level function. This is significant in that it allows you to find out how the slow function that triggers the bottleneck is connected to the other functions. This data can also be read in the timeline view. In this respect, the evaluation of the data can be done according to personal preference by the timeline or the call graphs.
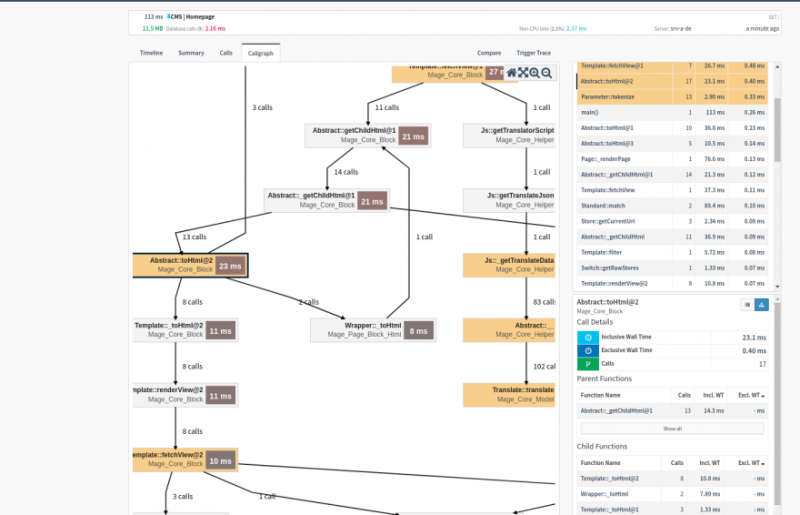
Screenshot 5: Call graphs
In both Timeline and Callgraph modes, there is also support for memory profiling. Firstly, you can see the amount of memory allocated during the full execution of a selected time period in the timeline profiler. Second, you can switch to the memory view and see a timeline of allocated memory from 0 to peak memory. And thirdly, the Callgraph Profiler can now display the allocated memory of each individual function call.
Compare view
With the Compare view of Tideways, two function calls can be compared directly with each other (see screenshot 6: Compare view). This allows changes in the code or behaviour to be analysed quickly. In the Compare view, data can be compared in a timeline (as shown in our example in the screenshot), by function or in call graphs.
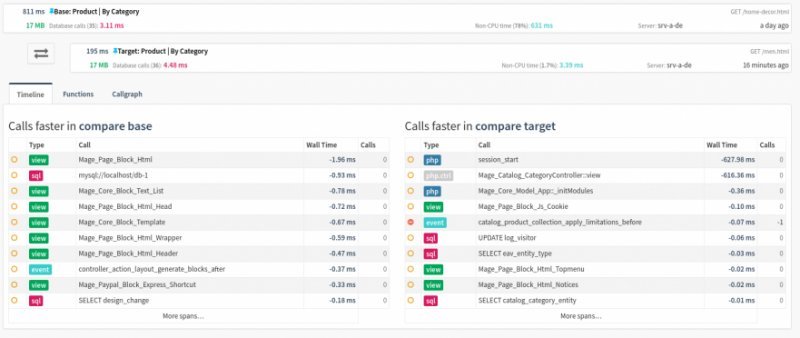
Screenshot 6: Comparison view
CLI analysis
In addition to analysing web calls, Tideways can also be used to view CLI calls.
The following command can be used to analyse a CLI command and create a profiling of the myscript.php file.
tideways run meineOrganisation/meineAnwendung php myscript.php
Web calls and API calls can also be analysed using Tideways' powerful CLI tools:
tideways run meineOrganisation/meineAnwendung curl http://test.de/fuu
Even a deployment can be tracked automatically in this way, so that it is visible in the Tideways Dashboard. All that is needed is the following call:
tideways event:create*meineOrganisation/meineAnwendung*"Deployed v4.2"
Further possibilities for CLI analysis are explained in the official instructions. Furthermore, the documentation explains how to start a Tideways analysis directly from PHP.
Monitoring
Monitoring provides the viewer with insights into the loading times of the entire online shop (see screenshot 7: Performance overview). Slower than usual loading times can be detected very quickly. If necessary, the technical manager can set real-time warnings in order to be warned of errors in good time. This function can be used from the Basic Edition.
This software also allows the response times, number of requests and errors to be read on a minute-by-minute basis at the application, service and individual transaction levels. The time frame for this can be set individually. This enables comparisons of application performance at specific times. Thus, the technically responsible person can check how the response times behaved in certain time frames for the visitors.
In the area of monitoring, the person responsible also builds the notifications into his or her own workflow according to his or her individual requirements. The notifications can be received via email, IRC, HipChat and Slack.
Tideways monitors the requests of visitors. The profiler analyses the PHP calls. It is therefore not necessary to specify which pages are to be monitored. The analysis also works in this way if Tideways is connected upstream of a load balancer or another service.
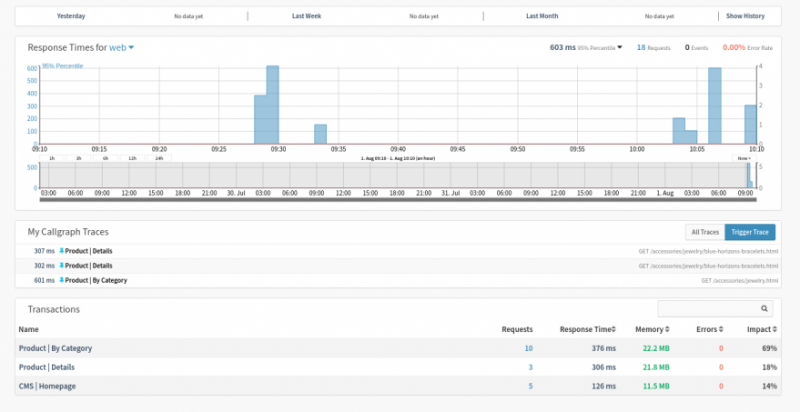
Screenshot 7: Performance overview
Error tracking
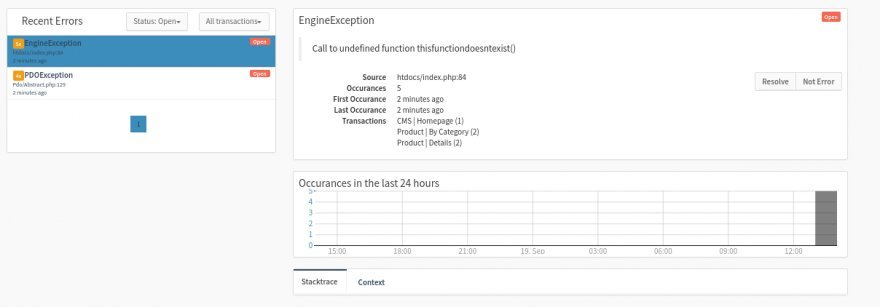
The Profiler also has an error tracking function (see screenshot 8: Error tracking). In all editions, errors can be localised before a shop visitor notices a malfunction. As soon as the errors occur, a defined person receives a notification from the Basic edition onwards and can immediately begin with the analysis. The error warning contains many important details, such as the source, the frequency of occurrence, affected transactions and the times of the first and last occurrence.
Application example
It is desired to install a 3rd party module in an existing online shop, which changes the product details of a page. Before the technical manager takes it into live operation, he wants to make sure that this module does not negatively affect the performance of the online shop. He therefore installs the module in a test environment and uses the Tideways Chrome Extension to profile the page.
This allows the person responsible to check what effects the plugin would have on the performance of the page. By checking with Tideways, it is possible for the technically responsible person to identify and rectify potential problems before the plugin goes live.
Set up Tideways at maxcluster
Tideways can be set up at maxcluster with just a few clicks. To do this, select the menu item "Profiler" in the Managed Center and use the button "Set up Tideways". After entering your API key and selecting the framework and sampling rate, you can set up tideways with just one click. The configuration can now be (de)activated at any time and applies cluster-wide. If you want to make VHost-specific settings, you can overwrite them in PHP. By the way,
More posts in this blog series
- Identifying bottlenecks with three efficient profiling tools
- Part 1: Blackfire IO
- Part 3: New Relic APM
- Part 4: Comparison of Blackfire, Tideways and New Relic
