Why? High performance is important for a good user experience (UX), because online shop shoppers expect immediate results for enquiries, purchase transactions, search orders etc. Only if the speed is noticeable - and we are sometimes talking about (milli)seconds here - does this lead to a higher conversion rate in the shop and thus to more sales.
What are Apache JMeter and the Magento 2 Performance Toolkit?
There are various ways to measure the performance of an online shop - in this blog article we will focus on performing load tests. We use Apache JMeter and the Magento 2 Performance Toolkit for this and use the predefined test cases for the measurement. The aim of such a measurement is to create a benchmark, i.e. to carry out a series of simulated operations with comparable results for different parameters.
Apache JMeter
Apache JMeter is an open source HTTP/S load generator software written in Java. With this software, loads can be simulated for different scenarios and performance data can be output in different ways, for example as CSV or XML files, but also as diagrams or graphics.
The software was developed for testing web applications. Not only can the functional behaviour be tested, but also the performance of a Magento site and the actual performance of the servers can be measured.
You can download the free software here. Please note that Java 8 or higher is required. In addition, you need JSON plugins to run the test.
Then carry out the following steps:
Magento Performance Toolkit
The Magento Performance Toolkit including metrics is an official part of Magento 2 (please note: you cannot use it in this form for a Magento 1 shop). With this toolkit you can test the performance of a Magento installation, the overall capacity of the server and the effects of any adjustments.
You can also generate sample data to test performance, which can then be used to run JMeter scenarios. In a combined benchmark, for example, over 290 different page activities are imitated.
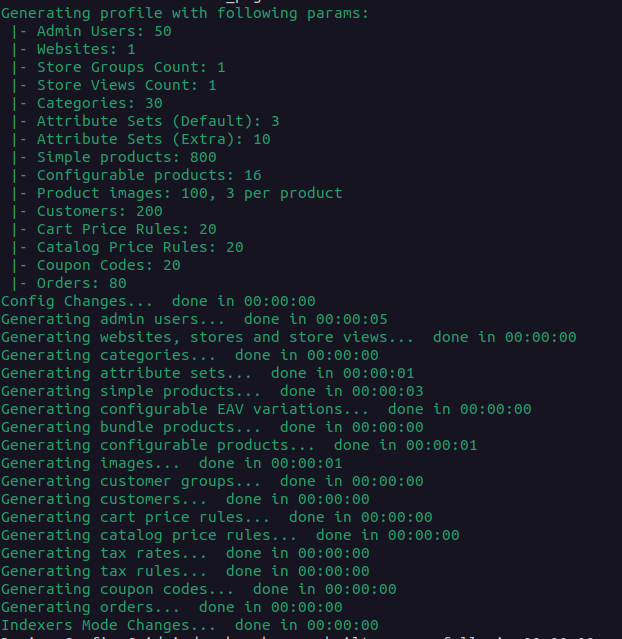
With the individual shop data generator, you can choose between four shop profiles so that the test environment can be selected to suit your own online shop:
- “Small”
- 1 website / 800 products / 30 categories
- 80 orders / 200 customers / attribute sets 10
- “Medium”
- 3 websites / 24,000 products / 300 categories
- 50,000 orders / 2,000 customers / attribute sets 30
- “Large”
- 5 websites / 300,000 products / 3000 categories
- 100,000 orders / 5,000 customers / attribute sets 50
- “Extra Large”
- 5 websites / 600,000 products / 6000 categories
- 150,000 orders / 10,000 customers / attribute sets 100
A demo shop created with a "Small" shop profile includes different attribute sets that any individual shop should also support.
By the way, based on our experience, we would refrain from setting up an "Extra Large" scenario, because on the one hand it is unrealistic for most online shops and on the other hand the set-up of this scenario can take up to three hours.
Preparation of the measurement
To prepare for the measurement, you will need a computer on which the JMeter load test tool can be run and a web server against which the load test will be run. We do not recommend running the tests on a production server unless it is ensured that it can handle the load during the test.
It should be noted that the results can be distorted by many factors, including RAM and CPU. For this reason, the tests should therefore be run in non-graphical mode, or the load generation should be distributed across several resources. Furthermore, it is a good idea to set up identical test pages without real product data in order to have the same database for the final comparison.
The following technical requirements should be met before the measurement:
Installing without sample data
As already mentioned in the previous section, you should carry out a Magento installation without sample data in order to guarantee comparability of the results. If a storefront with sample data already exists, we recommend that you uninstall any contributions that are not required (uninstall instructions).
In our test, we created the empty page with the global parameters set in the database using the Composer via the console.
php7.3 bin/magento cache:flush
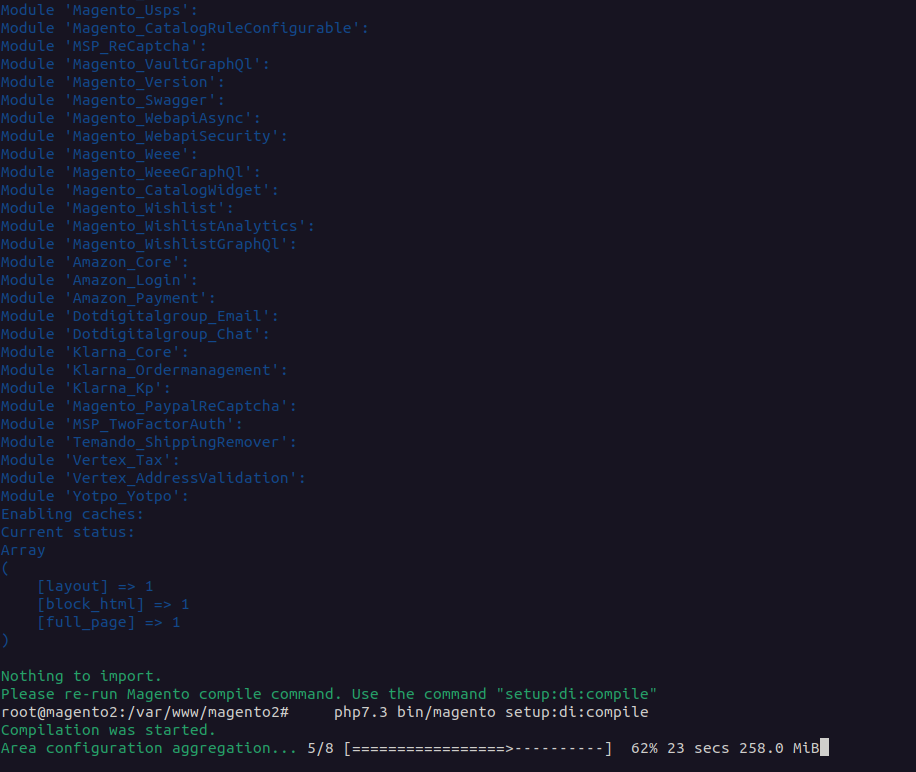
php7.3 bin/magento setup:upgrade
php7.3 bin/magento setup:di:compile
php7.3 bin/magento deploy:mode:set production
php7.3 bin/magento cache:flush
php7.3 bin/magento setup:upgrade
php7.3 bin/magento setup:di:compile
php7.3 bin/magento config:set catalog/frontend/flat_catalog_product 1
php7.3 bin/magento config:set catalog/frontend/flat_catalog_category 1
php7.3 bin/magento config:set dev/js/minify_files 1
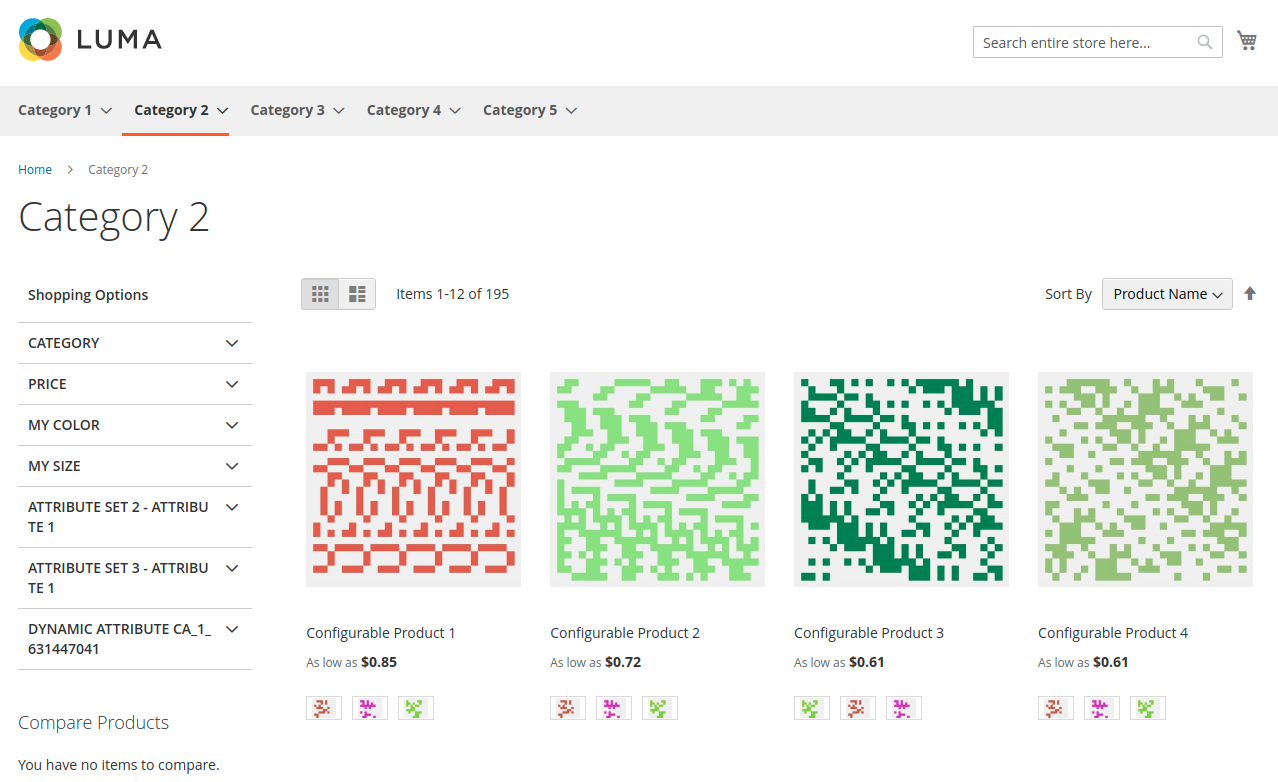
As a result of the steps listed, you will receive a storefront with generic categories including placeholder products:
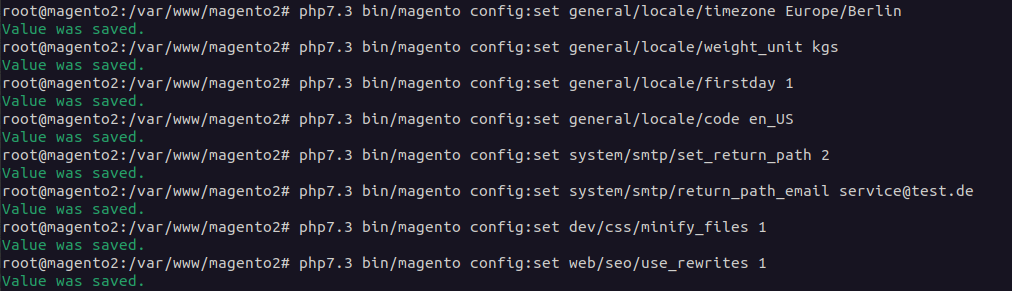
You should then configure the Magento site. For this, we recommend that you make the following setting:
php7.3 bin/magento config:set general/locale/timezone Europe/Berlin
php7.3 bin/magento config:set general/locale/weight_unit kgs
php7.3 bin/magento config:set general/locale/firstday 1
php7.3 bin/magento config:set general/locale/code en_US
php7.3 bin/magento config:set system/smtp/set_return_path 2
php7.3 bin/magento config:set system/smtp/return_path_email service@test.de
php7.3 bin/magento config:set dev/css/minify_files 1
php7.3 bin/magento config:set web/seo/use_rewrites 1
Installation of JMeter
After the test environment has been installed, JMeter is installed on the computer used to generate the test load. JMeter is available for all operating systems that use a Java environment.
TIP: We have found in our tests that it is advantageous if the installed JMeter is somewhat older. Unfortunately, however, this version has a faulty JavaJRR detection. You can remedy this with the following steps:
- Open the file "bin/jmeter2 in the JMeter file as a shell script.
- Find out your version of Java with java --version
- Edit MINIMAL_VERSION=1.8.0 in line 28 to e.g. MINIMAL_VERSION=11.0.10
Magento benchmark with JMeter
JMeter is now installed and ready to perform load tests. For the load tests, different test plans can be created for execution. You can create scenarios for your test plans both as a registered customer, i.e. an authenticated login to the system is required, or as a guest, without logging into the web application.
Examples of such scenarios are:
- Browse through the product catalogue
- Visit a product description page
- Add the product to the shopping cart
- Proceed to checkout and place your order
In our tests, we used the Combined Benchmark, which covers a variety of different scenarios. Here, for example, product updates and activities in the backend are also mapped correctly..
Perform tests
After installing JMeter, benchmark.jmx should be copied to the JMeter folder together with its subfolders. In our case, we start JMeter in a separate folder.

Once the test has been run, the test results are exported as HTML.
![]()
Test scenarios
There are two possible test scenarios, firstly the increasing load scenario and secondly the load tests, where the load is tested in realistic scenarios.
For the latter, the load tests, it is advisable to log in via SSH to check to what extent CPU and memory utilisation are increasing. It is important to know that with a steady increase in load, at a certain value for "No. of threads" (number of threads), the View Result Tree is displayed with an error. This can then be called the system breakdown point.
In the increasing load scenario, on the other hand, the load is increased by increasing the number of threads, users.
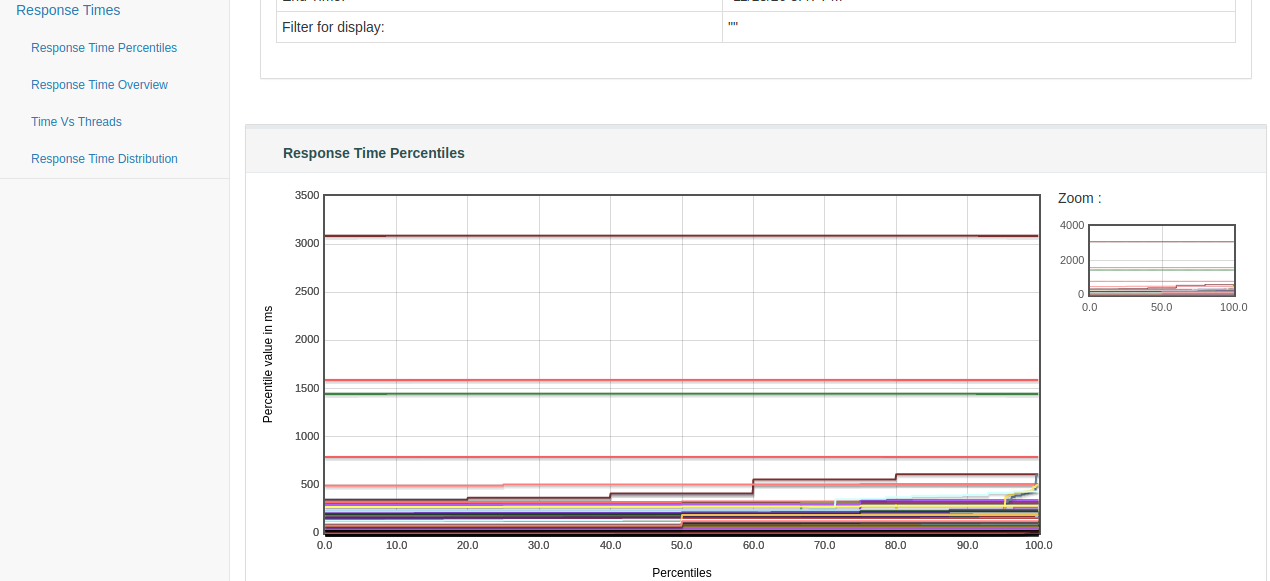
Evaluations with JMeter
The results of the evaluations provide you with metrics that can be used to assess how changes affect the performance and overall utilisation of the server. HTML reports with graphs and tables are also available, as are APDEX calculations and response time evaluations.
View versions
Different views can be selected for the evaluations:
- Aggregate report view
- Results tree view
- Graphical results
- Detailed URL Reports (Legacy)
- Summary Reports (Legacy)
We show you a brief overview of the first two below:
Aggregate report view
As the name suggests, this view gives you aggregated information about all requests, including:
- Number of requests
- Minimum
- Maximum
- Average
- Error rate
- Approximate throughput
Results tree view
This view is recommended for information about response times, headers and response codes. This view is particularly useful for debugging scenarios, but should be deactivated during load testing, as it consumes many resources.
Performance benchmark at maxcluster
In the following, we will give you an overview of how we conducted our current load tests at maxcluster and what results we came up with in the benchmarks.
Settings
Aufbau Demo-Shop für maxcluster-Benchmark
We chose a standard Magento 2.3 shop for our demo shop, including the performance patch we developed. We used the default settings, i.e. we did not include Redis or Elasticsearch. Furthermore, we did not use any optimisations. We chose a "small" InnoDB cache size for the database.
Shop profiles
For the shop profiles to be tested, we used the information from the Magento Performance Toolkit and selected the following profiles:
- “Small”
- 1 website / 800 products / 30 categories
- 80 orders / 200 customers / attribute sets 10
- “Medium”
- 3 websites / 24,000 products / 300 categories
- 50,000 orders / 2,000 customers / attribute sets 30
- “Large”
- 5 websites / 300,000 products / 3000 categories
- 100,000 orders / 5,000 customers / attribute sets 50
Web cluster
For our hardware, we chose 8 CPU and 16 GB RAM, as this configuration is often found among our customers.
We also used the following software:
- Apache 2
- MySQL 5.7
- PHP 7.3
Visitor behaviour
We also followed the guidelines of the Magento Performance Toolkit for visitor behaviour and opted for the Combined Benchmark. This checks 291 different endpoints, whereby it shows a good ratio of frontpage and backend calls. The Combined Benchmark also provides a consistently plausible set of data.
Load scenarios
To get a good overview of the performance of our servers, we have tested the following load scenarios:
- 4 threads
- 8 threads
- 16 threads
The hardware configuration remained unchanged at 8 CPUs.
Our learnings
The Magento 2 Performance Toolkit requires some preparatory work. The necessary automation and parameterisation can cost a developer several days of time, but at the same time you get a powerful tool for a professional development process. It answers many questions about the current performance of a shop, but does not provide information on how to improve it. Since a functional test is also carried out, the toolkit can contribute to both quality assurance and decision-making, depending on the question and objective.
As our requirement for the quality of our services is very high, we decided to develop a special software to compare the results of hundreds of benchmarks.
Conclusion
Apache JMeter and the Magento 2 Performance Toolkit offer an uncomplicated way for developers to test the performance of a server and the performance of an online shop themselves.
The combination makes it possible to generate sample data and running test scenarios and to use the results as a basis, for example, for decisions regarding server configurations or settings.
We recommend that Magento 2 developers evaluate their project with the Magento 2 Performance Toolkit early in the development process with a benchmark and a test plan. The APDEX can serve as a basis for this. If further features or extensions are added to the shop, the effects of the changes on performance can be checked within minutes and, if necessary, countermeasures can be taken in the event of a loss of performance. In addition, a qualified KPI for the performance of a shop can be formulated with the APDEX. The hardware and software configuration should also be specified precisely, as these usually have a great influence on the benchmark results. The early integration of a test plan supports expectation management and ensures fewer conflicts in the final phase of the project.
