Key points at a glance
- Performance issues in e-commerce almost never originate on the server, but rather within the application.
- Traditional monitoring does not reveal these root causes. The result: hours of debugging and a blame game between the hosting provider and the agency.
- With APM powered by Tideways, maxcluster closes this gap—directly within the Managed Center, with no setup required, and available for all PHP applications.
- Available now. An integral part of Business and Enterprise SLAs.
Scenario 1: Your online store loads slowly. Customers are leaving. And your monitoring tools say: everything is fine.
Scenario 2: CPU at 12%. RAM at 40%. No anomalies in the I/O metrics. But the product page takes four seconds to load.
Scenario 3: The checkout process is freezing. The bounce rate is rising. And you don’t know why.
These are typical scenarios in e-commerce. The server is running smoothly, all dashboards show green—but the store is still losing customers. Every delay measurably costs you conversions and revenue.
The problem isn’t that your store is slow. The problem is that you can’t see why.
The solution: APM powered by Tideways
Mit APM powered by Tideways bringt maxcluster Application Performance Monitoring direkt in die Hosting-Umgebung – ohne Setup, ohne zusätzliches Tool, ohne Systemwechsel. Du öffnest dein Managed Center, und die Performance-Daten sind da.
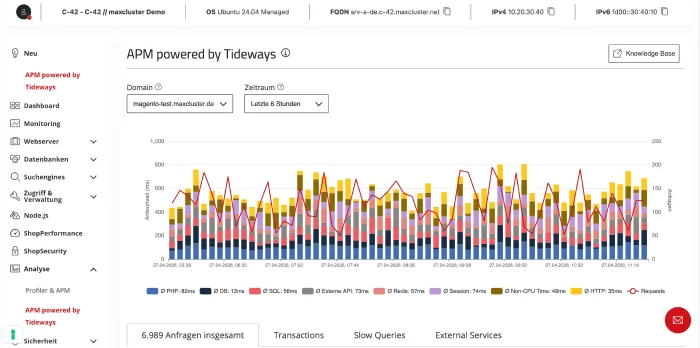
Bild 1: APM powered by Tideways im Managed Center
Du willst die Oberfläche selbst ausprobieren? Zur Live-Demo (ohne Anmeldung): https://demo.maxcluster.de/clusters/42/servers/1/managed/apm-powered-by-tideways
Statt im Blindflug zu suchen, siehst du sofort:
- Wo in deinem Shop Zeit verloren geht – aufgeschlüsselt nach Performance-Layern wie PHP, SQL, Redis, externe APIs (HTTP), Memcache, MongoDB, Elasticsearch, File I/O, Session, Autoloading, Compiling, APCu sowie weiteren Systemmetriken wie Non-CPU Time oder Waiting for CPU.
- Welche Komponente verantwortlich ist – welche Query, welche Funktion, welcher externe Service,
- Ob das Problem im Code oder in der Infrastruktur liegt – auf Basis derselben Daten.
APM powered by Tideways macht damit sichtbar, was klassisches Monitoring bisher nie zeigen konnte.
You can find a complete overview of all available performance layers and their meanings in our Knowledge Base article: https://knowledge.maxcluster.de/managed-center-apm-powered-by-tideways
What's really holding your store back—and what you don't see in your analytics
Performance issues in e-commerce are rarely caused by the server. They almost always originate in the application and follow typical patterns. Anyone who wants to optimize their e-commerce performance effectively needs to understand these patterns. And that is exactly what APM reveals.
Inefficient database queries
SQL queries are among the most common bottlenecks in e-commerce. Missing indexes, N+1 queries, unnecessarily complex JOINs—each individual query might only be 20 milliseconds slower than necessary. With 200 queries per page view, that adds up to seconds. This is particularly common in Shopware and Magento in product lists, filters, and the shopping cart. None of this is visible in server monitoring. In APM, every query is displayed individually with its runtime and stack trace.
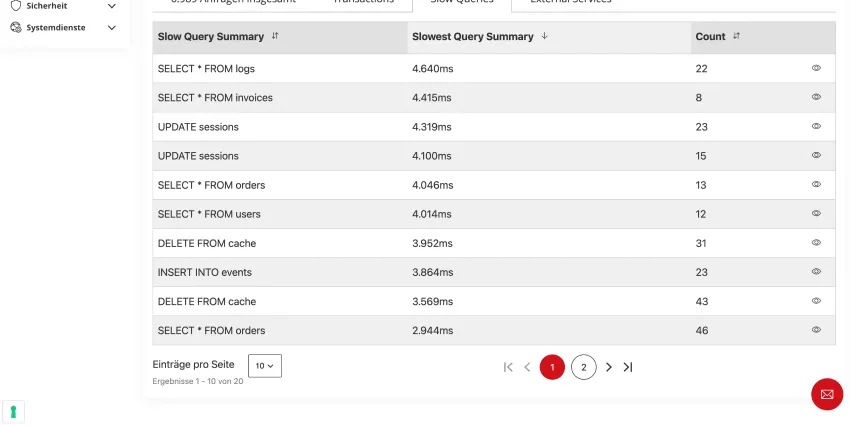
Figure 2: Slow Queries at a Glance: Which database query causes the longest response times, and how often is it executed?
Slow external APIs
ERP, payment, tracking—any synchronous API call can become a bottleneck. If an external service suddenly takes 800 ms to respond instead of 50 ms, the entire page load is put on hold. Your monitoring tools only tell you: “The server is running.” APM shows you: “It’s this specific payment provider that has slowed down."
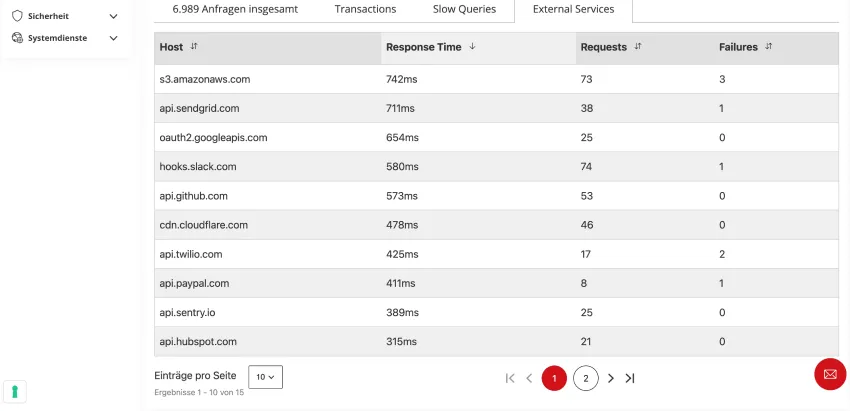
Figure 3: Overview of External Services: Which external APIs respond, how quickly—and where do failures occur?
Without this transparency, you're flying blind. With APM, you can see where time is being wasted and where you can focus your efforts.
Why traditional monitoring isn't helpful here
Server monitoring measures CPU, RAM, and disk I/O. Tools like Google Lighthouse evaluate the results in the browser. What happens in between—the path from the PHP request through the database to the final response—remains invisible in both cases.
And this is precisely what gives rise to a pattern that occurs time and again in e-commerce: the “blame game.” The shop owner suspects the server. The hosting provider sees no problem. The agency suspects the code. Everyone is working with different data, but no one has the full picture.
And while everyone is searching for the cause, the shop loses revenue.
Monitoring vs. APM – The Difference
To make the differences clearer, it’s worth making a direct comparison:
| Area | Server-Monitoring | APM |
|---|---|---|
| Analysing individual SQL queries | No | Yes |
| Identify slow API calls | No | Yes |
| Measuring the impact of deployment | No | Yes |
How APM is transforming teamwork
APM doesn’t just change how you identify performance issues—it changes how teams work together. When store owners, agencies, developers, and hosting providers all have access to the same data, debates over who’s responsible come to an end. The blame game is replaced by fact-based analysis.
In practice, this means three things:
Speed: What used to take hours or half a workday—searching through logs, deactivating plugins one by one, testing cache hypotheses—is now reduced to minutes. Developers can immediately see which components, database queries, or external services are affecting response times.
Clarity: No switching between different tools, no manual merging of logs. Server events and code deployments are correlated in a single view, and you can immediately see whether the outage is related to a release or a server restart.
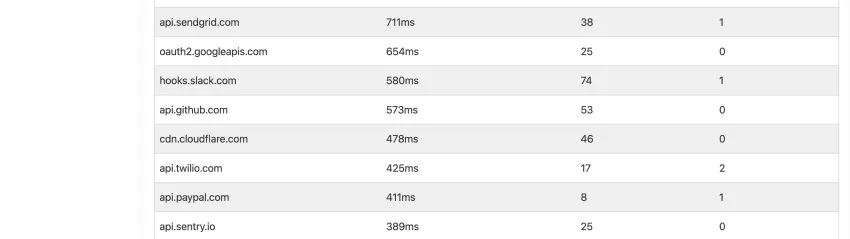
Figure 4: At a glance: 6,989 requests, 95% successful, but 158 client errors and 106 server errors. A quick status overview available without switching tools.
Alignment. Instead of debating assumptions, there is a common foundation. Decisions are made based on data, not on gut feelings or experience from similar cases.
Real-world example: The checkout process is getting slower
Without APM:
The checkout process suddenly slows down. Server metrics appear normal. Troubleshooting begins: checking logs, analyzing external services, disabling plugins one by one. The development team spends half a day on it. In the end, the cause remains unclear, or a change is made that doesn’t solve the problem. Meanwhile, the store owner loses orders—and thus revenue—without even realizing it.
With APM powered by Tideways:
Within minutes, it becomes clear: An external payment service is responding more slowly than usual—instead of 50 ms, the call now takes 800 ms. Or an SQL query has changed since the last deployment and is generating additional database accesses for every shopping cart request. The cause is clear, the analysis is targeted. And everyone involved is working with the same data.
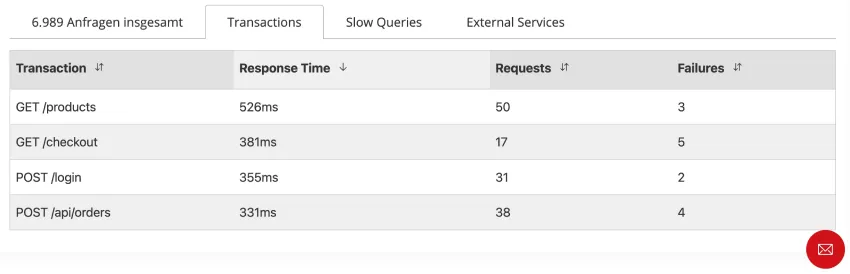
Figure 5: The Transactions overview immediately shows that GET /checkout responds in an average of 381 ms. Out of 17 requests, 5 contain errors, which pinpoints the bottleneck.
The difference isn't just the speed of the analysis. It's the quality of the decision.
Why Performance Isn't Just a Technical Detail
Load time directly influences whether a customer makes a purchase or leaves the site. Studies show that even a 0.1-second improvement in load time can increase the conversion rate by 8.4% and the average cart value by 9.2%. The Portent Page Speed Study confirms that e-commerce sites with a one-second load time convert 2.5 times better than those with a five-second load time.
At the same time, Google has established Core Web Vitals as ranking factors. A slow store therefore not only frustrates customers but is also penalized in organic search results. You can find more about the connection between loading time and revenue in our article on conversion rate optimization in e-commerce.
Performance is thus not just a technical issue, but a direct driver of your business success. And this is exactly where many shops lose money: not because they lack the infrastructure, but because they lack visibility.
Transparency that’s usually hidden behind paywalls
Comparable APM features—transparency regarding execution times, database queries, and external dependencies—are often only available on the market as paid add-ons or through external SaaS tools. The upfront costs can quickly run into several hundred euros per month, which—for many shop operators and agencies—is a reason to forego this transparency entirely. The result: performance issues only become apparent once they’re already costing revenue.
With APM powered by Tideways, this hurdle is eliminated. Diagnostics are integrated directly into the hosting environment, requiring no external tools or configuration.
It is currently available free of charge to all maxcluster customers through January 1, 2027, and will remain included in the Business and Enterprise SLAs thereafter.
APM powered by Tideways: Was das Tool ausmacht
As a managed hosting provider with a clear focus on e-commerce, we understand the demands of complex shop architectures. With APM powered by Tideways, this expertise translates into a concrete tool that clearly stands out from the standard APM market in three key ways.
Zero configuration and ready to use: The Tideways PHP extension is automatically activated for all active domains. No code changes, no manual setup, no additional tools. Unlike SaaS solutions that require days of integration work, you simply open your Managed Center and the performance data is right there.
Directly in the Managed Center with a unified data source: APM is part of your existing work environment. Server events and code deployments are correlated in the same view. You can immediately see whether a performance drop is related to a deployment, a server restart, or an external dependency, without having to switch between different tools.
Full data sovereignty - GDPR-compliant and Made in Germany: All performance and telemetry data remains on the maxcluster infrastructure in Germany. No data leakage to external clouds. In a market shaped by the EU AI Act and stricter data protection requirements, this is a decisive advantage, especially compared to US-based SaaS APM providers.
Specifically optimized for e-commerce: APM powered by Tideways is not a generic tool designed primarily for WordPress or SaaS monoliths. It provides visibility into typical performance bottlenecks in Shopware and Magento environments—such as database queries, external dependencies, or backend processes. These are the areas where performance makes the biggest difference for conversion rates and revenue.
This is just the beginning
APM powered by Tideways is the first component of a larger performance platform. Building on the diagnostic layer, we are already developing advanced features: automated analyses, intelligent pattern recognition, and prioritized recommendations for action. Today’s transparency will become tomorrow’s systematic performance optimization.
Who is APM powered by Tideways designed for?
Shop owners: You get a quick, easy-to-understand overview of your shop’s technical health. No expert knowledge or additional tools required. If loading times spike, you’ll see why immediately and can discuss specific next steps with your agency.
Agencies: You can back up your optimizations with hard before-and-after data. Instead of reactively processing tickets, you work proactively and position performance optimization as a value-adding service for your clients.
Developers: Targeted performance analysis instead of hours of debugging. You immediately see which components, database queries, or external services are affecting load times and can pinpoint causes in minutes instead of hours.
Get started now – in 30 seconds
You don’t need to install anything. No configuration, no risk, no extra effort. Your store’s performance data is already available.
What you can do now:
- Open your Managed Center and navigate to Analytics > APM powered by Tideways.
- See where time is actually being lost in your store—broken down by performance layers such as PHP, SQL, Redis, external APIs, and other components like Elasticsearch or file I/O.
- Identify the biggest bottleneck and start your first targeted optimization today.
You can find all the details on how to use it in the Knowledge-Base-Artikel zu APM powered by Tideways.
Conclusion
A stable server is the foundation, but it’s no guarantee of a fast online store. Most performance issues arise within the application itself: in database queries, caching strategies, external dependencies, or the code itself. Traditional monitoring doesn’t reveal these root causes.
APM powered by Tideways closes this exact gap and makes it available in the hosting environment where you’re already working. No setup, no tool changes, no additional costs. It’s your entry point into a performance platform that grows with your needs.
Frequently Asked Questions
Why is my online store slow even though my server monitoring shows that the server is running smoothly?
Because server monitoring only monitors the infrastructure. Performance issues in e-commerce often arise within the application—due to inefficient SQL queries, missing or faulty caching, slow external API calls, or poorly optimized plugins. These causes are invisible at the server level. Only application performance monitoring reveals where time is being lost within the application.
Is Google Lighthouse enough to improve the shop’s loading time?
Lighthouse measures the result in the browser—important for evaluation, but insufficient for root cause analysis. It shows you that a page is slow, but not why. APM is useful as a supplement for targeted root cause analysis. The actual optimization then takes place at the code, architecture, or infrastructure level.
What is the difference between server monitoring and APM?
Server monitoring checks the infrastructure: CPU, RAM, and disk usage. APM checks the application: PHP execution times, SQL queries, API calls, and code behavior. Both complement each other—but only APM shows which function, database query, or external service is slowing down page loading.
