Fast loading time equals good user experience
The loading speed of a website determines how users experience it—and whether they stay at all. It influences the conversion rate, Google ranking, and general user behavior. If you want to be successful in online retail, you need to ensure that your site responds quickly and loads content rapidly—especially on mobile devices.
In this article, you will learn why PageSpeed is a key success factor today, which metrics are important, which tools are suitable for analysis, and how you can achieve real performance gains with six specific optimization levers.
What is PageSpeed – and why is it so important?
PageSpeed describes how quickly a website displays content to the user and responds to input. It's not just when the page is “fully loaded” that counts, but above all when the main content is displayed and how smoothly the interaction runs.
Core Web Vitals is an umbrella term for a series of metrics used to determine how user-friendly a website is in practical use in terms of loading times, interactivity, and visual stability.
A study by Deloitte (https://www.deloitte.com/ie/en/services/consulting/research/milliseconds-make-millions.html) also proves that loading time means revenue: even an improvement of just 0.1 seconds can increase the conversion rate by up to 8.4% and the average order value by 9.2%. Speed pays off – measurably.
Loading time and sales: Calculating ROI
An example shows how much of a financial impact better loading times can have:
With 200,000 visitors, a conversion rate of 2.22%, and an average order value of $174, this already results in millions in revenue. Improving the loading time to 1 second can significantly increase the conversion rate and revenue.
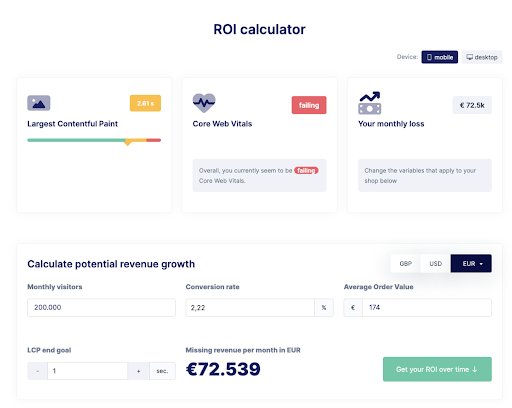
You can calculate this potential for your own shop using the free PageSpeed ROI Calculator from RUM-Vision (https://www.rumvision.com/tools/roi-calculator/).
Why PageSpeed is particularly important on mobile devices
More than 60% of global internet traffic now comes from mobile devices – and this trend is on the rise. Users expect fast, smooth navigation even when they are on the go. If a page loads too slowly, they will usually leave it immediately.
Since Google introduced its mobile-first index, the mobile version of a page is primarily taken into account for ranking. If it is slow, this also affects the desktop ranking.
Mobile devices are also often used on weaker networks and have less computing power. Those who do not optimize specifically for these conditions risk high bounce rates and waste revenue potential.
Lab data vs. field data
A sound analysis is the basis of any optimization. There are two types of measured values:
- Lab data comes from controlled tests with defined conditions (e.g., simulated 4G network). It helps to identify technical problems at an early stage – ideal for the
development phase. - Field data is based on real user experiences. It shows how the page performs under real conditions on different devices and in different networks.
Tools for measuring website speed – and when you should use which one
Fortunately, there are a number of tried-and-tested tools available for evaluating the analysis, which take different perspectives depending on whether you are in the development phase, analyzing an existing site, or want to monitor performance in live operation.
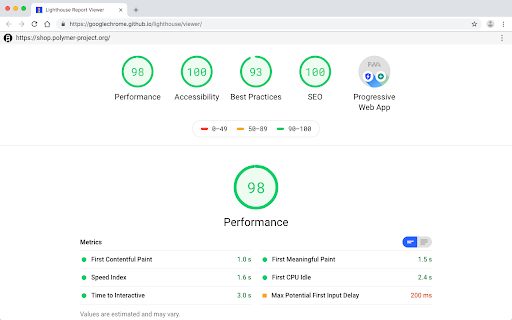
Google Lighthouse
- Open source tool, directly integrated into the Chrome browser's developer tools
- Ideal for the development and optimization phase
- Simulates loading behavior under specified conditions (e.g., slow 4G, throttled CPU)
- Evaluates performance as well as accessibility, SEO, and best practices
- Simulation conditions can be adjusted to meet Google PageSpeed Insights criteria
- Provides detailed technical information on optimization potential
Google PageSpeed Insights (PSI)
- Easily accessible without implementation
- Combines lab data with field data from the Chrome User Experience Report (CrUX)
- Shows how fast a page loads for real users
- Simultaneously provides an evaluation under standardized laboratory conditions
- Clear evaluations and concrete recommendations for action are provided for each metric
- Particularly suitable for monitoring success after website launch or after optimizations
RUM Vision
- Measures loading times based on real user interactions in real time
- Measures all Core Web Vitals: The tool shows how fast important page content loads, how responsive a click is, and how stable the layout remains
- Segmentable evaluation: Collects data from different devices, browsers, and network conditions
- Provides continuous monitoring of website performance in everyday use
- Alerts: Detects conspicuous patterns in certain regions, device types, or time periods
- Particularly valuable for evaluating optimizations and monitoring front-end performance.
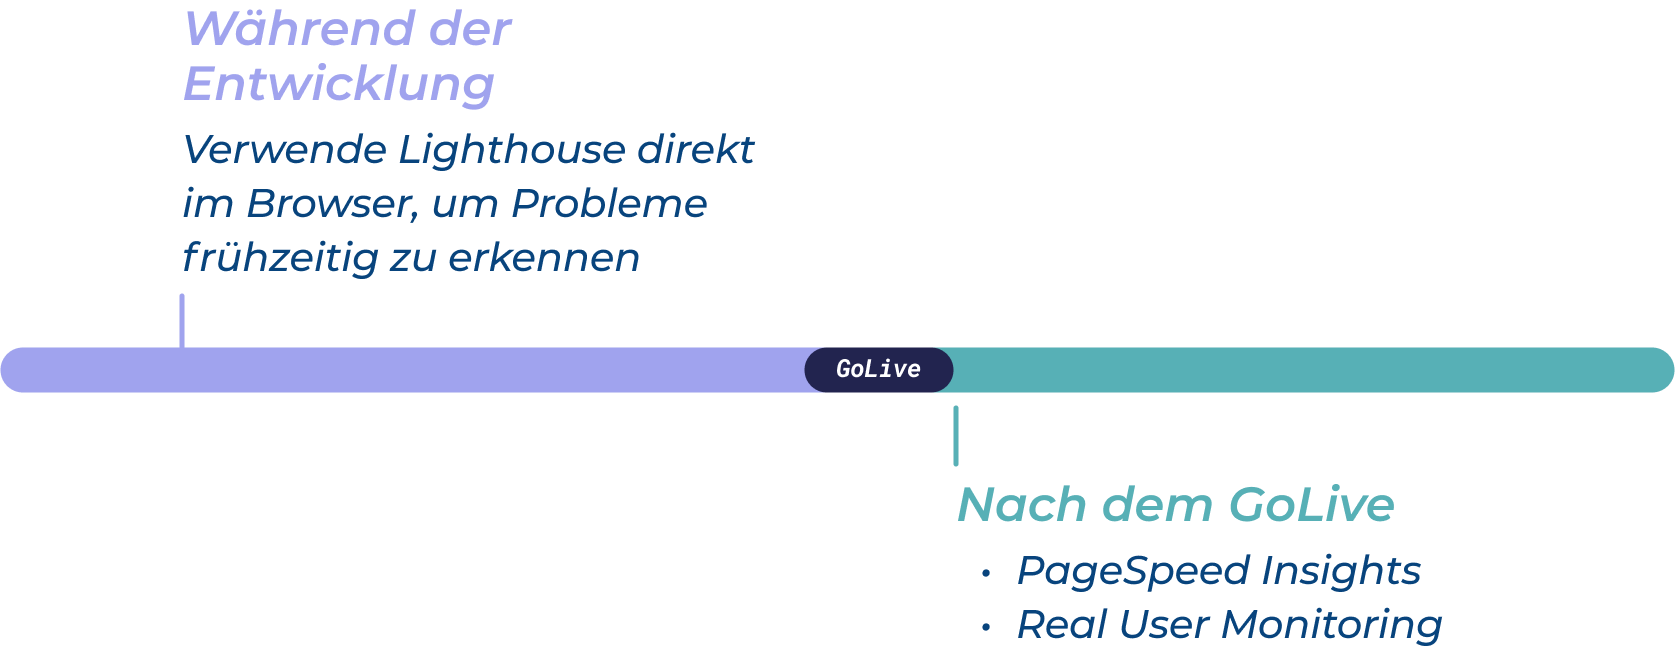
Which tool you use therefore depends heavily on the point in time: During development, Lighthouse is ideal for identifying technical weaknesses. After go-live, PageSpeed Insights offers a balanced combination of test environment and real data. And for ongoing monitoring in everyday use, a tool such as RUM-Vision is the right choice for permanently observing performance and optimizing it in a targeted manner.
Overview of the most important metrics
In order to improve the loading speed of a website in a targeted manner, it is important to understand the key metrics – the so-called PageSpeed metrics. These values help to identify weaknesses and make improvements measurable. The best-known metrics recommended by Google are part of the Core Web Vitals, supplemented by other performance indicators.
- Largest Contentful Paint (LCP) measures how long it takes for the largest visible content – usually an image or a large block of text – to appear on the page. This metric is particularly important for perceived speed: if the main content is visible quickly, users perceive the page as fast. A good LCP value is below 2.5 seconds.
- Cumulative Layout Shift (CLS) shows how stable the layout remains when the page is loaded. If elements shift during loading – for example, because an image without a fixed size is reloaded – the user experience suffers. Google recommends a CLS value of less than 0.1 to avoid disruptive
layout shifts. - Time to First Byte (TTFB) indicates how quickly the server responds to a request and sends the first byte to the browser. A low TTFB indicates good server configuration and fast caching. A value below 500 milliseconds is good. Especially in combination with caching solutions and hosting infrastructure such as maxcluster, TTFB is an important indicator of basic technical speed.
- First Contentful Paint (FCP) measures when the first visible content – for example, a section of text or an icon – is loaded. It is an early indicator of overall performance, even if the main content may not yet be visible. An FCP of less than 1.8 seconds is considered good.
- Interaction to Next Paint (INP) is a newer metric that measures how quickly the page responds to interactions (e.g., clicks) – not just the first time, but throughout its entire use. It is particularly relevant for interactive shops with filters, shopping cart logic, or dynamic content. Here, too, the target value is less than 200 milliseconds.
These metrics are not just theoretical figures, they have real implications: the better they are, the happier your visitors will be and the better your page will perform in search engines.
Six levers to noticeably improve PageSpeed
1. Shorten loading times with optimized media (LCP)
Use modern formats such as WebP or AVIF – they offer significantly smaller file sizes with the same quality. Also use responsive images and lazy loading: this means that only visible content is loaded, which noticeably speeds up the initial page load. This also applies to iFrames and videos. Please note: Do not use lazy loading in the immediately visible area (above the fold) to avoid delays in display.
JavaScript should also be integrated asynchronously (async) or delayed (defer) so as not to block rendering. A critical CSS file can also help: Only the styles that are necessary for the initially visible area are delivered directly
– the rest is reloaded.
2. Reduce server response times (TTFB)
A high-performance server is a must. Use tools such as Redis to cache frequently used content and for fast session handling.
Varnish can cache HTML pages as a reverse proxy and deliver them at lightning speed – without burdening the PHP application. Dynamic content is reloaded via Ajax, for example. When configuring Varnish, watch out for unnecessary URL variants with tracking parameters. Such parameters lead to different cache entries despite identical content, thus reducing cache efficiency. Tools such as RUM Vision help you identify and specifically exclude these parameters:
Services such as Cloudflare can also provide compression, image optimization, and security functions as an upstream CDN, further reducing loading times.
3. Avoid layout shifts (CLS)
Ensure that all media have fixed heights and widths. Dynamically reloaded content such as advertising banners should already have their place reserved in the layout. For web fonts, the CSS rule font-display: swap; helps to display immediately visible text with a fallback font with the same character width.
4. Reduce render-blocking resources
CSS and JavaScript files should be integrated in such a way that they do not interfere with rendering. Load non-critical resources only after the initial page load. This shortens the time until the first visible interaction and significantly improves the loading time perceived by the user.
5. Critically review third-party scripts
Every additional tracking or chat tool slows down page loading. Check whether functions are really needed or can now be implemented natively. Only integrate external scripts if they offer real added value, and then please do so asynchronously.
6. Update your system regularly
Keep your entire hosting stack and your application up to date. Current PHP versions such as PHP 8.4 not only offer better security, but also significantly better performance.
Databases such as MySQL or MariaDB also regularly benefit from performance improvements in current versions. Likewise, Magento includes targeted optimizations with almost every release that have a positive effect on loading time and system stability.
However, updating to a new PHP version is not always possible immediately.
With maxcluster's PHP Extended Support, you can still stay on the safe side: You will continue to receive security updates for EOL versions such as PHP 7.4 or 8.0 and can continue to run your application stably – without any time pressure to switch.
One scan, one check, one fast shop – request a free performance quick check now.
A fast website is not a technical nice-to-have, but a real competitive advantage. It ensures better user experiences, higher conversion rates, and better rankings on Google. Regular analysis and targeted optimization not only reduce loading times, but also sustainably increase the success of your online shop.
However, in everyday life, it is often difficult to gain an outside perspective or find the time to deal with the technical implementation in detail. This is exactly where our free Magento Performance Quick Check comes in:
We analyze your online store in terms of loading time, technical bottlenecks, and Core Web Vitals. In a short video call, we discuss the results together, highlight optimization opportunities, and answer your questions – without obligation and free of charge.
Request now at: e3n.de/magento-performance-quick-check
Whether as preparation for peak times such as Black Friday or as a basis for sustainable performance optimization, the Quick Check is the ideal first step toward a noticeably faster, more stable, and more successful shop.
If you also want to keep an eye on the technical infrastructure of your shop, it's worth taking a look at the hosting setup.
ShopPerformance from maxcluster: Keeping an eye on the technical foundation
While our Quick Check analyzes the Core Web Vitals and the front end of your shop, ShopPerformance from maxcluster goes one step deeper. The tool checks server and application settings directly on your system—e.g., PHP, cache, and database configuration—and supplements them with values from Google PageSpeed Insights. Combined with our Quick Check, this provides a comprehensive view of your shop's performance—from user experience to system basics.
Conclusion: Small measures, big impact – if you stick with it
Performance optimization begins with looking at the right numbers: If you know where the problem lies, you can take targeted action instead of groping in the dark. Tools such as Google PageSpeed Insights or RUM-Vision provide measurable indicators that can be used to make specific improvements.
The best part is that even small technical adjustments, such as caching, image optimization, or third-party scripts, can have a noticeable effect on loading time, user experience, and revenue.
But optimizing once is not enough. Performance is not a project with an end date, but a continuous process. Those who regularly check, readjust, and orient themselves to current metrics remain competitive – on all devices, at all times.
Authors
Jonas Niebergall
With over 15 years of experience in e-commerce and a special focus on page speed, Jonas knows exactly how important loading times are for the success of an online store. Jonas loves to find the root cause of slow online stores. Through quantitative analysis, he identifies the most effective levers to achieve a big impact with small, targeted changes.
Mathias Elle
Mathias Elle has been working as a web developer for 20 years and brings a wealth of experience to our projects. With his passion for performance and UX optimization, he ensures fast, user-friendly, and accessible web applications. As a PageSpeed expert, he knows the best tools and techniques for optimizing loading times.
About e3n
We have been developing online shops with Magento since 2012 – primarily for medium-sized companies. One focus of our work is on implementing high-performance front ends with Hyvä. We place great importance on short loading times, accessibility, and consistent display on all devices. As a Hyvä Gold Partner, we have supported numerous projects in this area.
For complex B2B requirements, we rely on the Magento-based solution Avanta, which was developed specifically for medium-sized businesses. It offers a comprehensive set of functions and supports the efficient implementation of individual business processes.
We use the low-code platform n8n to connect systems such as PIM or ERP. This allows individual interfaces to be implemented efficiently and maintainably.
The e3n team combines technical expertise with a good understanding of operational processes. In our collaboration, we value clear communication and practical solutions.
About the authors
Jonas Niebergall | e3n CEO
With over 15 years’ experience in e-commerce and a particular focus on page speed, Jonas knows exactly how important loading times are to the success of an online shop. Jonas loves getting to the root of why online shops are slow. Through quantitative analysis, he identifies the most effective ways to achieve a big impact with small, targeted changes.
Mathias Elle | e3n Frontend Entwickler
Mathias Elle has been working as a web developer for 20 years and brings a wealth of experience to our projects. With his passion for performance and UX optimisation, he ensures that our web applications are fast, user-friendly and accessible. As a PageSpeed expert, he knows the best tools and techniques for optimising load times.
About e3n
We have been developing online shops using Magento since 2012 – primarily for medium-sized businesses. A key focus of our work is the implementation of high-performance front-ends using Hyvä. We place great importance on fast loading times, accessibility and consistent display across all devices. As a Hyvä Gold Partner, we have supported numerous projects in this area.
For complex B2B requirements, we rely on the Magento-based solution Avanta, which was developed specifically for SMEs. It offers a comprehensive set of modules and supports the efficient implementation of individual business processes.
To integrate systems such as PIM or ERP, we use the low-code platform n8n. This allows us to implement custom interfaces efficiently and in a way that is easy to maintain.
The e3n team combines technical expertise with a sound understanding of business processes. In our collaboration, we place great importance on clear communication and practical solutions.
